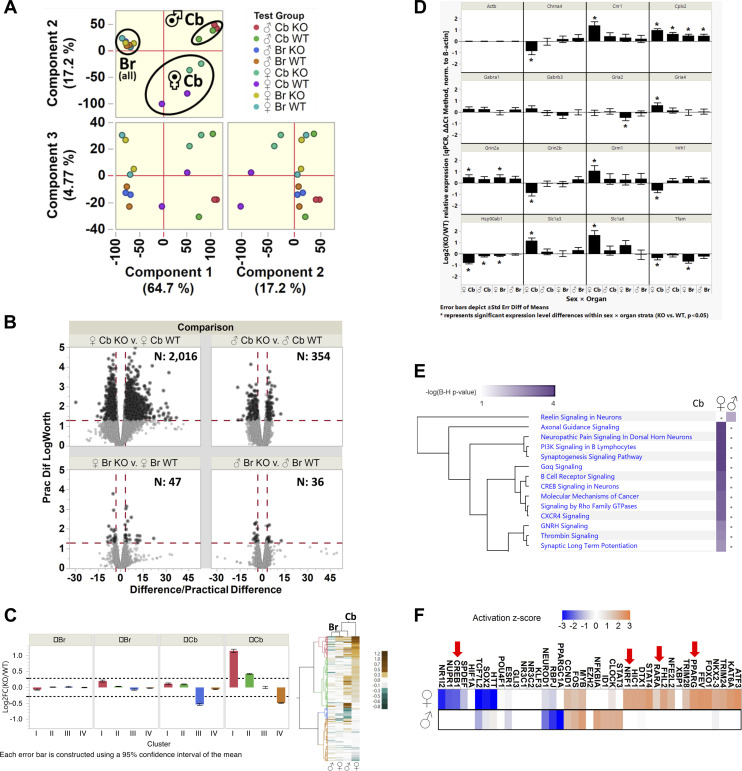
Figure 3. Loss of the short interspersed nuclear element isoform leads to sexual dimorphic gene expression profiles.
(A) Principal component analysis of 12,527 multivariate significant probe sets (RMA-normalized probe intensities, log2FC ANOVA FDR P < 0.05, |log2FC| > 0.286 for SNR > 1 versus grand mean; PC1organ + PC2sex = 82% total variance) was used to determine the main components driving the differences between gene expression profiles of wild-type and mutant littermates. (B) Volcano plots depicting 9,996 statistically differential probe sets between any genotype × organ × sex groups overall (multivariate significant, log2FC post hoc pairwise P < 0.05; 5% practical difference |log2FC| > 0.094); black highlights 2,363 differential probe sets combined that meet differential criteria in same-organ, same-sex comparisons between WT versus short interspersed nuclear element KO mice, the number of which is indicated inside each panel. (C) Gene expression data were segregated into patterns using unsupervised hierarchical clustering based on 1,980 single-gene probe sets encompassing 1,615 gene annotations, corresponding to the subset from same-sex 2,363 differentially expressed probes curated against RIKEN cDNA clones, multi-gene, or no-gene annotations. The heat map on the right (Cb, cerebellum; Br, rest of brain, that is, whole brain minus cerebellum) depicts the patterns giving rise to the distinct clusters: red cluster I (330 single-gene probe sets, 257 genes, log2FC min: +0.12, max: +3.48, IQR: [+0.84, +1.31]), green cluster II (807 single-gene probe sets, 677 genes, log2FC min: −0.32, max: +0.92, IQR: [+0.34, +0.55]), blue cluster III (172 single-gene probe sets, 156 genes, log2FC min: −1.53, max: −0.10, IQR: [–0.63, −0.38]), and orange cluster IV (671 single-gene probe sets, 591 genes, log2FC min: −2.79, max: +0.27, IQR: [–0.57, −0.37]); cluster-wise expression differences were deemed statistically robust based on |log2FC| > 0.286 (SNR > 1 threshold). (D) RT-PCR was used to confirm the microarray identified glutamate-associated changes. (E) Ingenuity Pathway Analysis based on the curated list of 1,980 single-gene differential probe sets with statistically robust expression differences per group (|log2FC| > 0.286; male cerebellum: 457 probe sets; female cerebellum: 1,738); dots indicate pathways without significant enrichment within gene sets per group. (F) Upstream regulators predicted based on the genes differentially expressed in the cerebellum of females (left) or males (right). Genes were analysed together or based on having or not a PGC1α recognition sequence within ±1 Kb of the annotate promoter. Z-scores range depicting activation (orange) or inhibition (blue) is shown.

