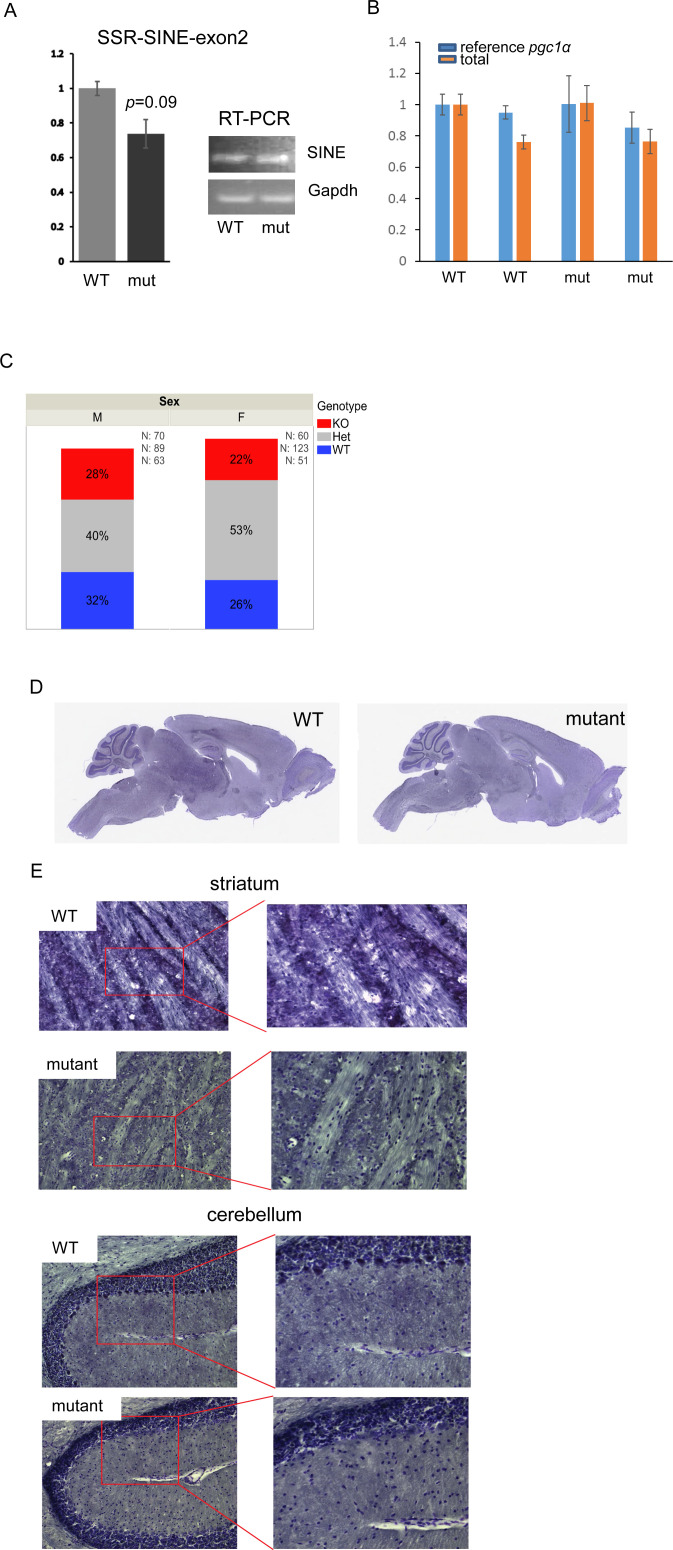
Figure S2. Characterization of short interspersed nuclear element (SINE) mutant mice.
(A) Quantitative RT-PCR using primers that span the junction between the SINE and exon 2 (left graph) were used to determine expression level of this isoform in whole brain of WT and mutant animals; N = 3/group; each reaction was performed in triplicates. Error bars depict ±SEM. t test was used for statistical significance. GAPDH was used to normalize data; insert show representative qRT-PCR products ran on an agarose gel. (B) Graph shows data reflecting expression of the reference (primers spanning exons 1–2) or total (primers spanning exons 2–3, common to all isoforms) levels of Pgc1α in the same animals. (C) Genotype frequencies by sex among offspring born from breeding of SINE heterozygous mutant mice, based on Pearson’s chi-square test of homogeneity (N = 456 total offspring, * denotes P = 0.028); WT—wild-type homozygous, Het—heterozygous KO, and KO—homozygous KO. (D, E) Gross sections of brains from control or mutant littermates; scale bars are 4 mm for (D) and 65 μm for (E).

