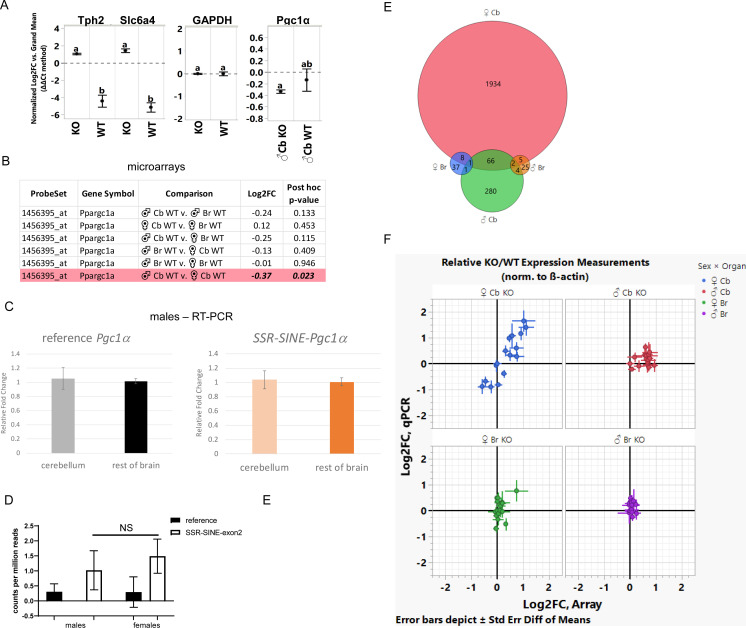
Figure S4. Gene expression analysis in the brains of WT and functional KO animals.
(A) RT-PCR was performed in the cerebellum of an independent cohort of WT and KO animals to confirm microarray data (n = 3/group). Error bars were constructed using one standard error of the mean; groups not sharing letters are statistically significant (post hoc Tukey HSD test P < 0.05). (B) Comparison of PPARGC1a (or PGC1a) probe intensity based on microarray data on female versus male cerebellum or rest of the brain. (C) RT-PCR was used to amplify a fragment of the reference pgc1α transcript (covering the boundaries of exons 1–2) or the simple sequence repeat-short interspersed nuclear element (SINE)-exon 2 (covering boundaries of the SINE-exon 2) in the cerebellum or rest of the brain of WT males (n = 3); values are relative to GAPDH. (D) Reads covering the junction of exons 1–2 or SINE-exon 2 were estimated in the brains of male and female C57B6/J mice (n = 3/sex). (E) Overlap of probes differentially enriched in the cerebellum or rest of the brain (cerebrum minus cerebellum) between mutant and WT littermates based on sex. Red—female cerebellum, green—male cerebellum, blue—female rest of the brain, and orange–—male rest of the brain. n = 4 per genotype. (F) Correspondence between gene expression changes identified by microarrays and RT-PCR.

