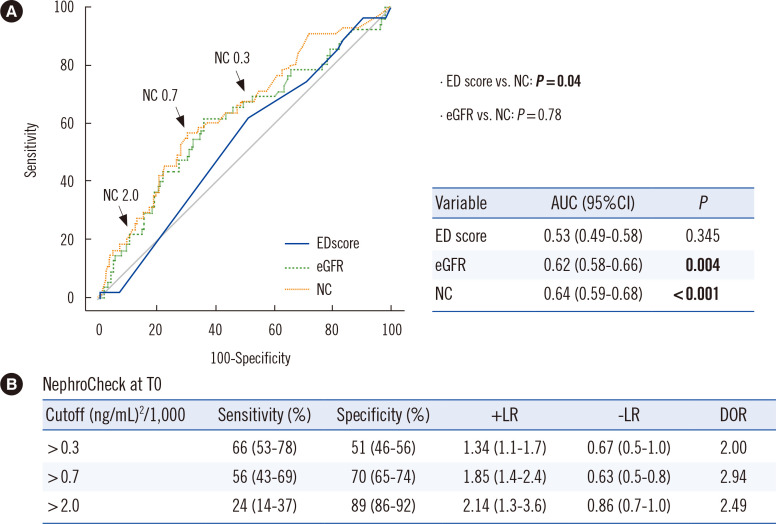
Fig. 3.
Prediction of AKI development based on three parameters measured at ED arrival (T0). (A) In ROC curve analyses, NC better predicted AKI development than the ED score (P=0.04). (B) The sensitivity, specificity, and LR of the two validated NC cutoffs (>0.3 or >2.0) and an optimal cutoff (>0.7) are presented as % (95% CI).
Abbreviations: ROC, receiver operating characteristic; AUC, area under the ROC curve; CI, confidence interval; LR, likelihood ratio; DOR, diagnostic odds ratio; see Table 1.

