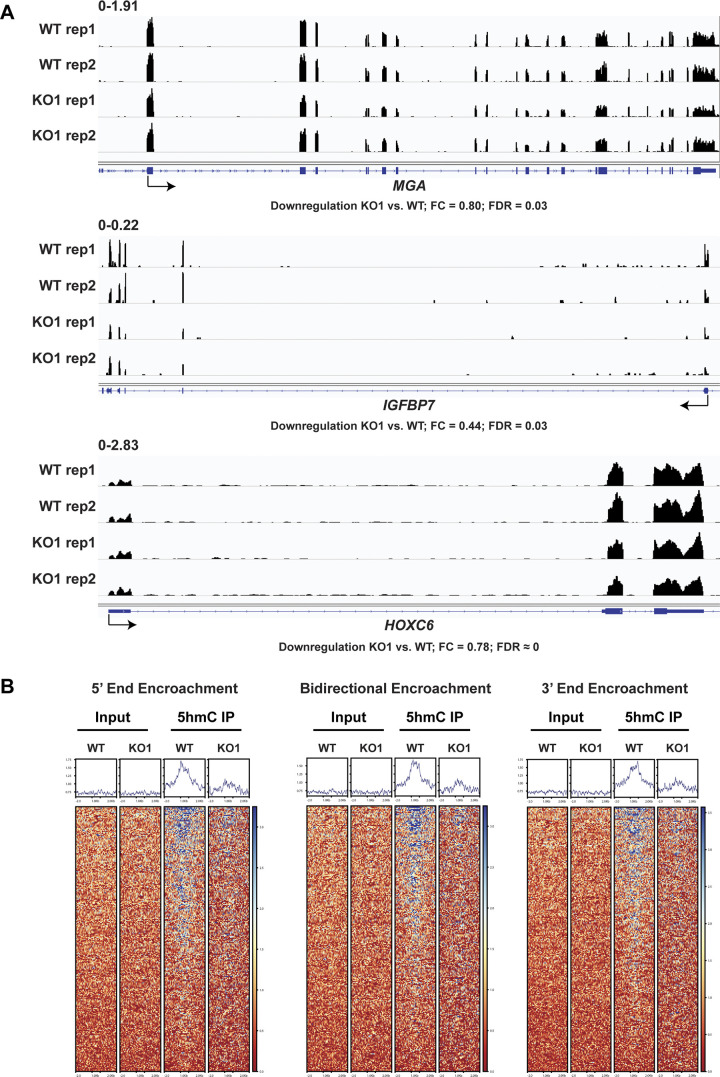
Figure S6. PROSER1 controls DNA demethylation at CpG islands and transcription of associated target genes.
(A) Genome browser tracks showing the RNA-seq profiles of the MGA, IGFBP7, and HOXC6 genes in WT and PROSER1 KO HEK293 cells. Two replicates are displayed for each genotype. (B) Heat maps showing hMeDIP-seq results of 483 identified CGIs with DNA hypermethylation encroachment in PROSER1 KO compared with WT HEK293 cells. Heat maps were grouped based on 5′ end encroachment (left), bidirectional encroachment (middle), and 3′ end encroachment (right). The color scale depicts the 5hmC methylation range.

