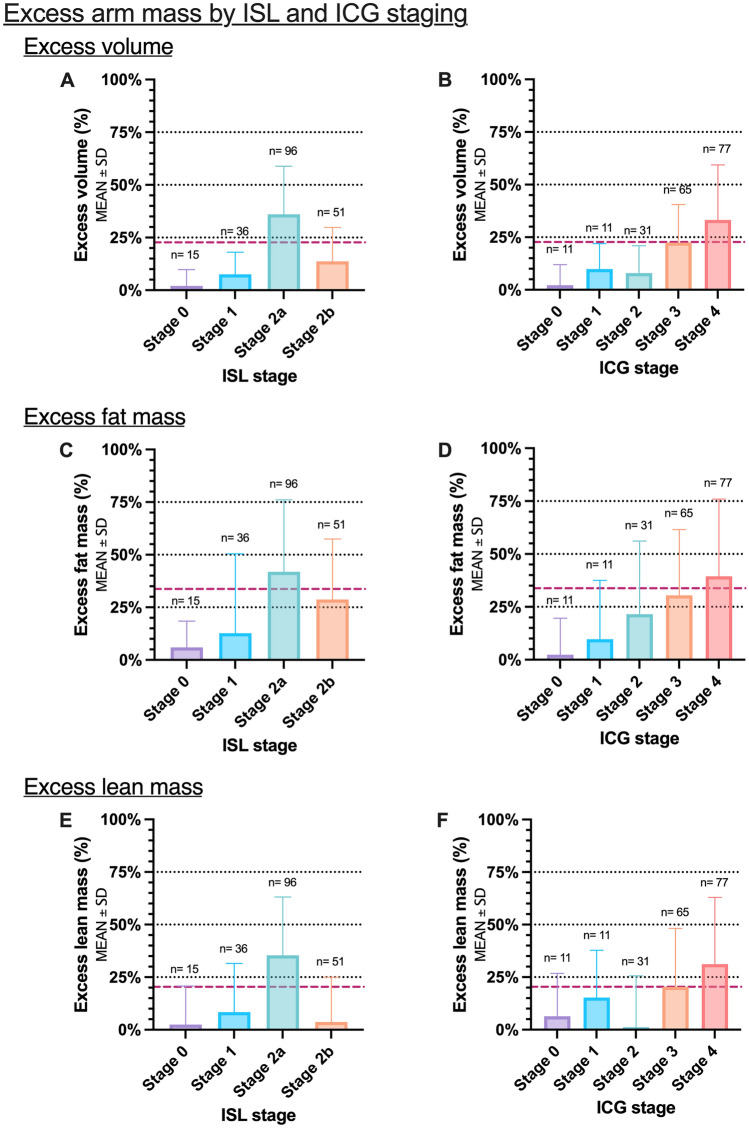
Figure 2.
This figure shows the distribution of excess arm volume, fat and lean mass in lymphedema patients stratified by clinical ISL and lymphangiography staging. (A) Excess volume and ISL stage. (B) Excess volume and ICG stages. (C) Excess fat mass and ISL stage (D) Excess fat ass and ICG stages. (E) Excess lean mass and ISL stage (F) Excess lean mass and ICG stages. Black horizontal dotted lines denote 25%, 50%, and 75%. The red striped line denotes the mean excess volume, fat and lean mass for the study. *P-value < 0.05. **P-value < 0.001.

