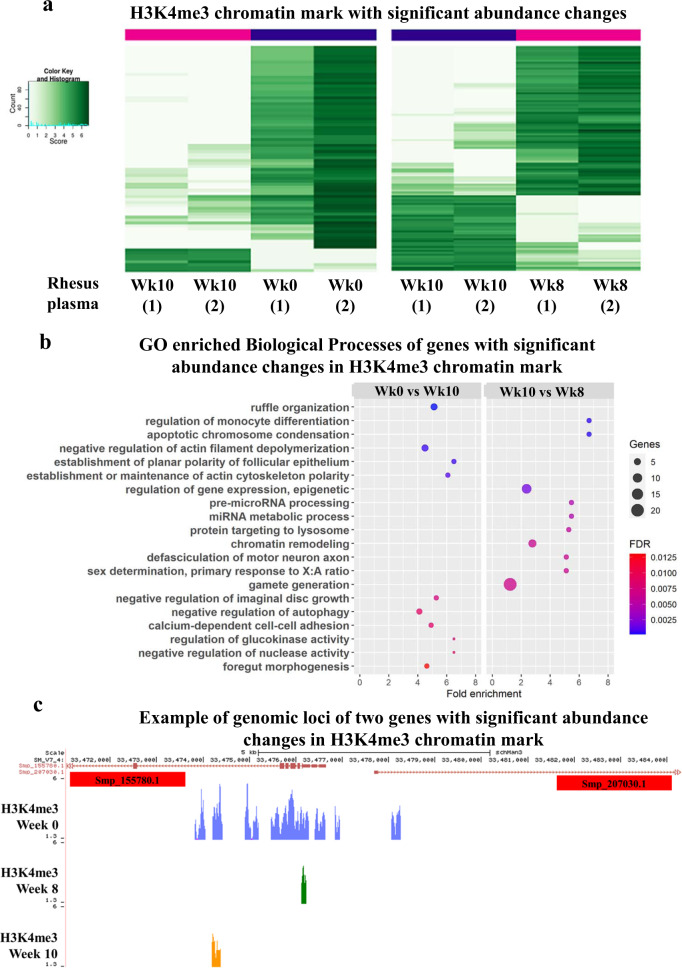
Fig. 8. Changes in H3K4me3 chromatin mark occupancy at gene loci in 3-day-old schistosomula cocultured with rhesus plasma.
a The abundance of H3K4me3 histone marks at each gene locus (one gene per line) was determined by ChIP-Seq in schistosomula cultured for a further 48 h in the presence of 33% v/v plasma collected from rhesus at Week 10 post-infection, and compared with the H3K4me3 abundance in schistosomula cultured with plasma from Week 0 (left panel) or plasma from Week 8 (right panel); only the genes with significant changes in chromatin mark abundance in the comparisons are shown. Chromatin peak abundance at each gene is colour-coded; light green represents low peak counts and the dark green represents high counts (see colour key). b Gene Ontology classification of significantly enriched (FDR <0.0125) Biological Processes of genes with changes in H3K4me3 abundance in schistosomula cultured with rhesus plasma. Left panel, enriched GOs in the comparison between treatment with Week 10 vs Week 0 plasma; right panel, enriched GOs in the comparison between treatment with Week 10 vs Week 8 plasma. c Snapshot of a S. mansoni genome browser image (http://schistosoma.usp.br), showing a region spanning 5 kb on chromosome 4, where two protein-coding genes Smp_155780 and Smp_207030 are located (top red track). Note that these genes map head-to-head in this locus, i.e. they are transcribed in opposite directions, with their transcription start sites (TSSs) near each other in the centre of this locus region. Below the red track, three other tracks show the H3K4me3 ChIP-Seq peaks detected in the 3-day-old schistosomula cultured with plasma collected at Week 0 (blue track), Week 8 post-infection (green track) and Week 10 post-infection (orange track).

