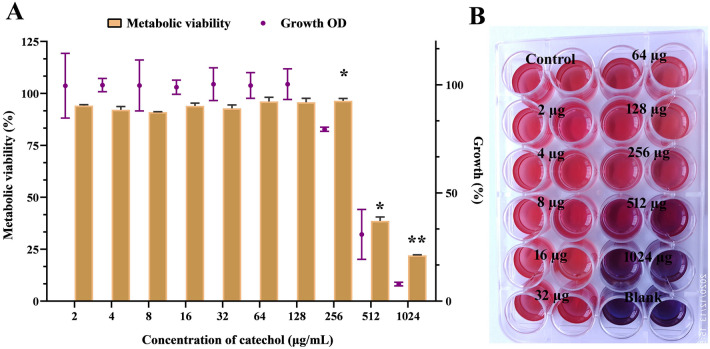
Figure 1.
The influence of catechol (0–1024 μg/mL) on C. albicans planktonic growth. (A) Measurement of C. albicans cell density and metabolic viability after grown for 24 h in the presence and absence of catechol using broth micro dilution and alamar blue assay, respectively. Error bars indicates the mean values of three experimental triplicates. The “* “and “**” symbols represents the statistical significance of p < 0.05 and p < 0.01, respectively. (B) Representative MTP stained with alamar blue show the true metabolic state of catechol treated C. albicans cells.

