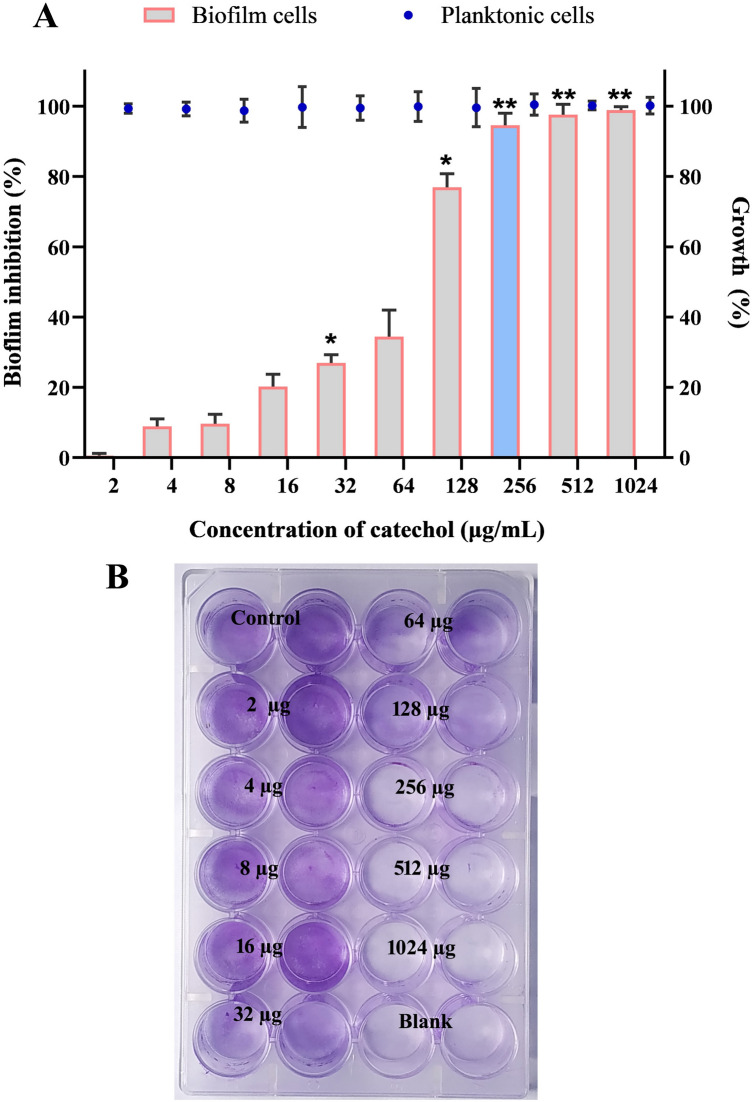
Figure 4.
Antibiofilm efficacy of catechol at varied concentrations. (A) Measurement of biofilm formation and planktonic growth in presence of catechol at various concentrations. Significant dose dependent reductions of biofilm formation were observed in the cells treated with catechol compared to untreated control without affecting the C. albicans planktonic growth. Blue colored bar in the graph signifies the BIC value of catechol. Error bars indicates the mean values of three experimental triplicates. The “* “and “**” symbols represents the statistical significance of p < 0.05 and p < 0.01, respectively. (B) Representative MTP image that portraying the impact of catechol on C. albicans biofilm.

