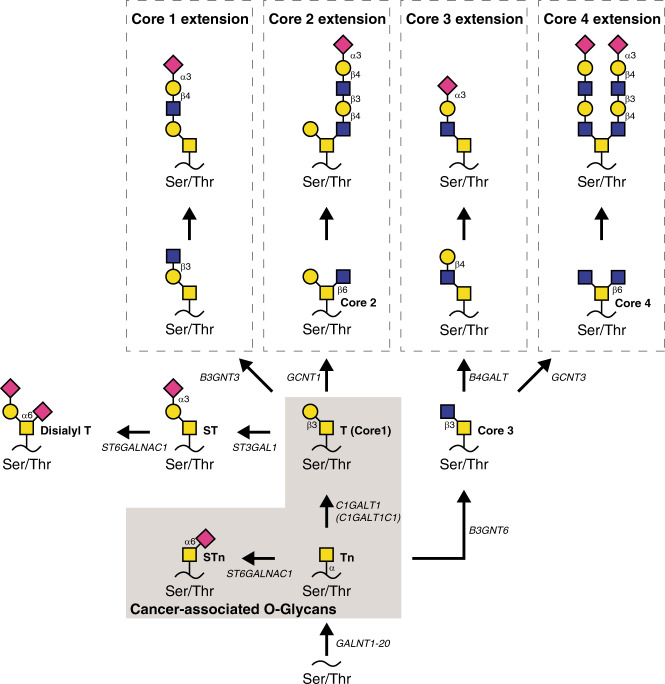
Fig. 1. O-glycan biosynthesis and structure.
Overview of the biosynthesis of core 1, 2, 3 and 4 O-GalNAc glycans (adapted from Varki et al. [15]). Black backbones depict proteins, black lines depict glycosidic bonds with the type of bond assigned. Arrows illustrate enzymatic elongation of glycan structures catalysed by assigned transferases. Structures highlighted in the grey box are the cancer-associated glycans mapped in this study. The graphic depiction is in accordance with the Symbol Nomenclature for the Graphical Representation of Glycans [80]. Yellow square = GalNAc. Pink square = Sialic acid (Neu5Ac). Blue square = Glucose. Yellow circle = Galactose. Tn-antigen = Thomsen-nouveau antigen, STn-antigen = sialyl-Tn antigen, T-antigen = Thomsen-Friedenreich antigen, Ser/Thr = serine/threonine.

