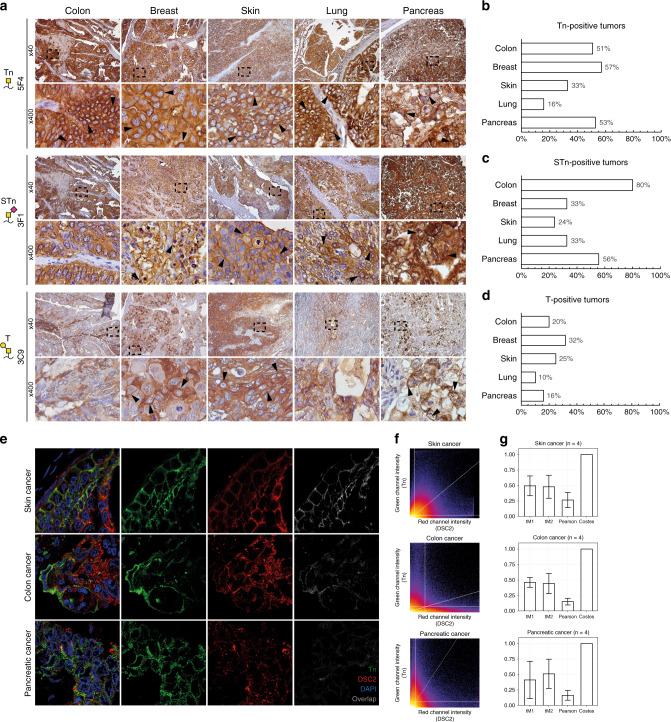
Fig. 2. Truncated O-glycans are surface exposed in tumours of epithelial origin.
a Representative micrographic pictures at ×40 magnification and ×400 magnification (black box) of five different epithelial tumour samples IHC stained using monoclonal antibodies against the Tn- (5F4), STn- (3F1) and T-antigens (3C9). Arrows highlight membranous accentuation. b–d Graphic illustrations of the percentage of each stained type of cancer staining positive for the given glycan structure. e Representative confocal images of skin, colon and pancreatic tumours stained for the Tn-antigen using the VVA lectin (green) and desmocollin-2 (DSC2, red). Nuclear staining was done using DAPI. From left to right: combined channel image, green channel image (Tn), red channel image (DSC2) and the grayscale image showing only co-localised pixels following co-localisation analysis. f Representative fluorograms, dot plots showing the green and red intensity of each individual pixel of the image. Thresholds for the green and red channels are indicated as horizontal and vertical lines, respectively, and a trendline for the correlation has been drawn as a diagonal line. g Barplot representing mean ± SD of calculated Manders’ co-localisation coefficients (tM1 and tM2), Pearson correlation coefficients, Costes’ P values from confocal images of skin (n = 4), colon (n = 4) and pancreatic (n = 4) tumours.

