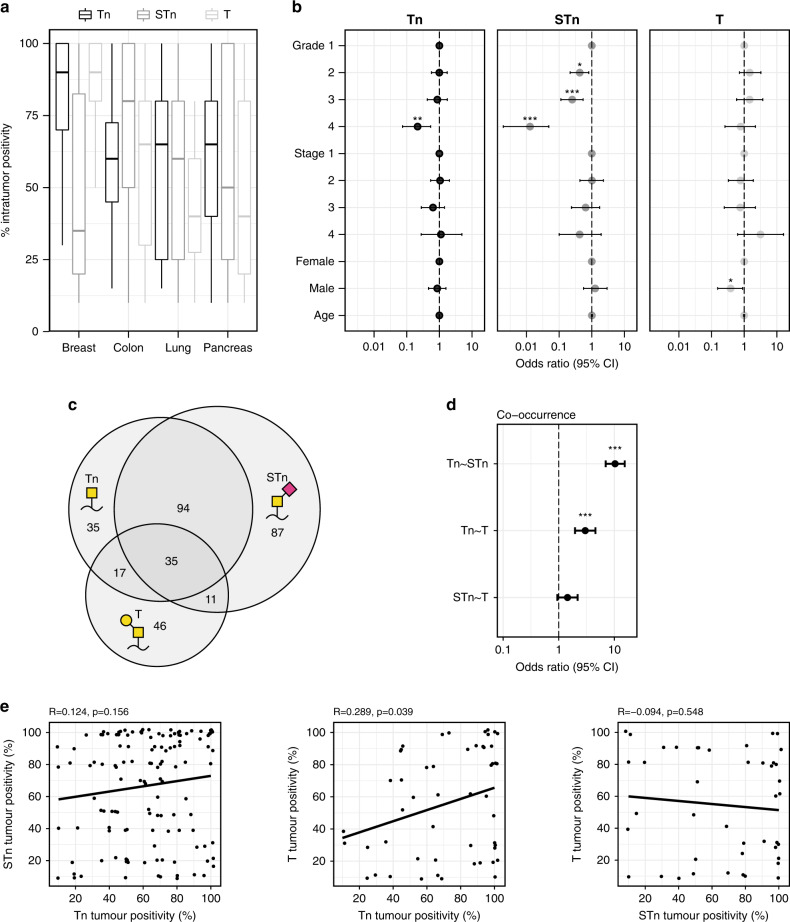
Fig. 4. Statistical analysis of expression of truncated O-glycans.
a Boxplots showing the distribution of the percentage of cancer cells expressing truncated O-glycans within positive tumours. b Odds ratios and 95% confidence intervals for the expression of the Tn-, STn- or T-antigen. For cancer grade, odds ratios were calculated compared to grade 1 cancers and were controlled for sex and age. For the cancer stage, odds ratios were calculated compared to stage 1 and were controlled for sex and age. For sex, odds ratios were calculated comparing male to female and were controlled for the grade, stage and age. For age, odds ratios were controlled for the grade, stage, and sex. c Venn diagram showing the number of tumour sections staining positive for respectively the Tn-, STn- and T-antigen, either alone or in combination. The number of tumour sections within the given sections of the diagram are depicted. d Odds ratios and 95% confidence intervals for the co-occurrence of Tn-, STn- and T-antigens. e Scatterplots representing the percentage of cancer cells within tumours positive for Tn-, STn- and T-antigen. The line represents trendline calculated for Pearson correlation coefficient. *P < 0.05, **P < 0.01, ***P < 0.001.

