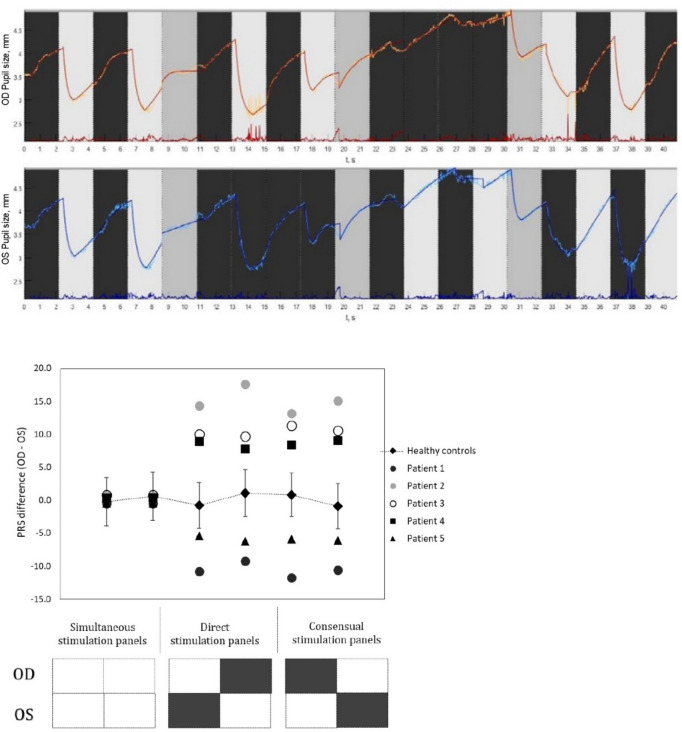
Figure 7.
The top panel displays the generated pupil traces from a patient with clinically detected RAPD. Pupillogram showed normal pupil traces during the simultaneous stimulation phase (Sim OU) and unilateral stimulation phase OD (Uni OD), but during the unilateral stimulation phase OD showed no constriction responses from the pupil on light stimulation which was persistent during the Alternating stimulation phase (Alt OD and Alt OS) as well. The bottom panel shows the scatter plot generated using the mean inter-pupillary difference in PRS coefficient values for the healthy subjects (Error bar represents the SD) and the five patients with clinically diagnosed RAPD. The X axis represents the stimulation panels whereas the Y axis displays the inter-pupillary difference in PRS.

