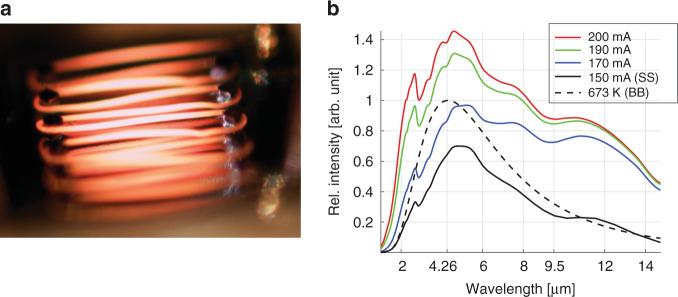
Fig. 2. Image of the IR emitter and related IR emission spectra.
a Visible light image of the IR emitter during the burn-in of the Kanthal filament prior to mounting of the wavelength-selective lid. The IR emitter pads are electrically contacted using probes to perform a functional test. The suspended filament parts in the center of the emitting zone glow brighter than the filament near the guiding posts. b Diagram with multiple emission spectra from the IR emitter measured with the FTIR spectrometer. The relative intensity of the emitted IR radiation is plotted versus the wavelength in micrometer. The measured emission spectrum (black) using the step scan (SS) measurement mode shows good agreement with the calculated black body spectrum (BB) at 400 °C (black dashed line), considering an emissivity of 0.7 for Kanthal alloys. Additional measured emission spectra using constant driving currents are depicted with red, green, and blue lines, showing a significant discrepancy in the long-wavelength range beyond 6 μm. This is due to the background radiation emitted by the substrate and the package

