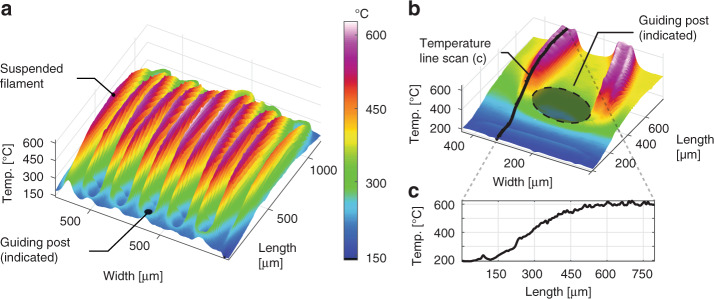
Fig. 3. Thermal characterization of the IR emitter.
a 3D plot of the temperature distribution over the IR emitter area showing temperatures between 120 °C and 680 °C. The meander-shaped filament showed a maximum temperature of 680 °C at the center of the emitting zone, i.e., the suspended filament parts with the largest distance from the guiding posts. In this experiment, the IR emitter was powered with a constant current of 150 mA, corresponding to a power consumption of 0.8 W. b Close-up of the temperature distribution near a guiding post. The guiding post has a significantly lower temperature than the suspended filament. c Line scan of the temperature along a filament, starting from the guiding post until the suspended part of the filament at the center of the emitting zone

