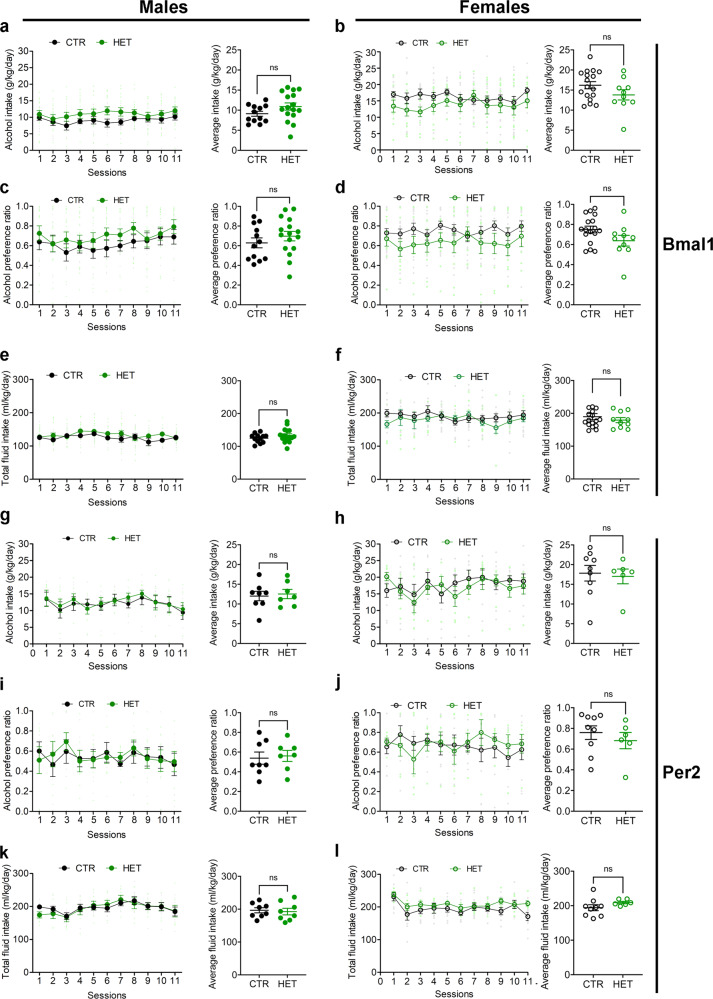
Fig. 3. Alcohol drinking behavior of control, Bmal1, and Per2 heterozygote mice.
a Daily alcohol intake (left) and average alcohol intake (right) of control and Bmal1 heterozygote male mice. Two-way repeated measure ANOVA (RM-ANOVA), no significant effect, F (1, 26) = 2.793, p = 0.1067, Unpaired two-tailed t-test, NS. b Daily alcohol intake (left) and average alcohol intake (right) of control and Bmal1 heterozygote female mice. RM-ANOVA, no significant effect, F (1, 25) = 2.507, p = 0.1259, Unpaired two-tailed t-test, NS. c Daily alcohol preference (left) and average alcohol preference (right) of control and Bmal1 heterozygote male mice. RM-ANOVA, no significant effect, F (1, 26) = 1.326, p = 0.26, Unpaired two-tailed t-test, NS. d Daily alcohol preference (left) and average alcohol preference (right) of control and Bmal1 heterozygote female mice. RM-ANOVA, no significant effect, F (1, 25) = 3.506, p = 0.0729, Unpaired two tailed t-test, NS. e Total fluid intake (left) and average fluid intake (right) of control and Bmal1 heterozygote male mice. RM-ANOVA, no significant effect, F (91, 26) = 1.498, p = 0.2320, Unpaired two-tailed t-test, NS. f Total fluid intake (left) and average fluid intake (right) of control and Bmal1 heterozygote female mice. RM-ANOVA, no significant effect, F (1, 25) = 0.5874, p = 0.4506, Unpaired two-tailed t-test, NS. g Daily alcohol intake (left) and average alcohol intake (right) of control and Per2 heterozygote male mice. RM-ANOVA, no significant effect, F (1, 13) = 0.09317, p = 0.7650. Unpaired two-tailed t-test, NS. h Daily alcohol intake (left) and average alcohol intake (right) of control and Per2 heterozygote female mice. RM-ANOVA, no significant effect, F (1, 13) = 0.08137. p = 0.7799. Unpaired two-tailed t-test, NS. i Daily alcohol preference (left) and average alcohol preference (right) of control and Per2 heterozygote male mice. RM-ANOVA, no significant effect, F (1, 13) = 0.01314, p = 0.9105. Unpaired two-tailed t-test, NS. j Daily alcohol preference (left) and average alcohol preference (right) of control and Pe2 heterozygote female mice. RM-ANOVA, no significant effect, F (1, 13) = 0.04381, p = 0.8375. Unpaired two-tailed t-test, NS. k Total fluid intake (left) and average fluid intake (right) of control and Per2 heterozygote male mice. RM-ANOVA, no significant effect, F (1, 13) = 0.02780, p = 0.8702. Unpaired two-tailed t-test, NS. l Total fluid intake (left) and average fluid intake (right) of control and Per2 heterozygote female mice. RM-ANOVA, no significant effect, F (1, 13) = 1.833, p = 0.1988. Unpaired two tailed t-test, NS. NS = no significant differences. The values express mean ± S.E.M. a–f, CTR: control, HET: Bmal1 heterozygote. a, c, e CTR n = 12, HET n = 16. b, d, f CTR n = 17, HET n = 10. g–l CTR: control, HET: Per2 heterozygote. g, i, k CTR n = 8, HET n = 7. h, j, l CTR n = 9, HET n = 6.

