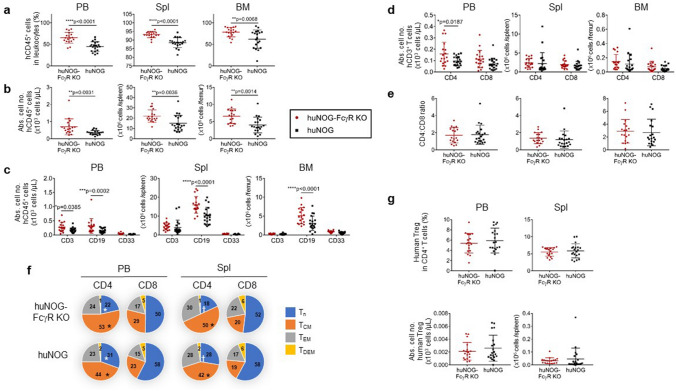
Figure 2.
Characteristics of human immune cells in NOG-FcγR−/− mice. Flow cytometry analysis of huNOG and huNOG-FcγR−/− mice at 18 weeks after HSC transplantation. Mononuclear cells from PB, spleen, and BM were examined. (a,b) The frequencies (a) and numbers (b) of human CD45+ cells in the indicated tissues. Cumulative results from two independent experiments are shown with the average and SD bars. (c,d) The numbers of human CD3+ T cells, CD19+ B cells, CD33+ myeloid cells (c), and T-cell subpopulations (CD4+ and CD8+) (d) are shown. (e) Ratios of CD4+ to CD8+ T cells from (d). (f) Subpopulations in CD4+ and CD8+ T cells. T cells were subdivided into Tn (CD45RA+CD62Lhi), TCM (CD45RA-CD62Lhi), TEM (CD45RA-CD62Llo), and TDEM (CD45RA+CD62Llo) based on the expression of CD45RA and CD62L. The average frequencies of each subpopulation were calculated from flow cytometry data (Supplementary Fig. 2) and depicted in pie charts. (g) The frequencies and numbers of human Tregs. Tregs were identified as FOXP3+CD25+CD45RA-CD4+ cells detected by intracellular staining45 and the data from individual mice are plotted with the average and SD bars. The numbers of huNOG and huNOG- FcγR−/− mice were 20 (19 for BM analysis) and 18, respectively. Asterisks, or a pair of symbols indicate statistical significance in (a–d), or in (f), respectively. The p-value was obtained using two-tailed Student’s t-test between huNOG and huNOG-FcγR−/− mice [*p < 0.05, **p < 0.01, ***p < 0.001, ****p < 0.0001 in (a–d), and *p < 0.05, †p < 0.01 in (f)].

