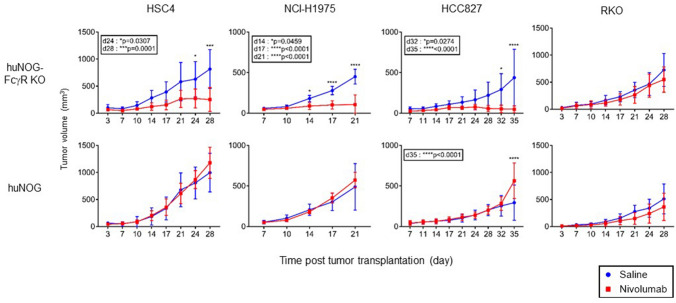
Figure 3.
Nivolumab-induced tumor suppression in huNOG-FcγR−/− mice. HSC4, HCC827, NCI-H1975, and RKO cells were subcutaneously inoculated in the flank of huNOG or huNOG-FcγR−/− mice at 12–14 wpt. When the tumor became palpable, 200 μg nivolumab (red line) or saline (blue line) was administered by intraperitoneal (i.p.) injection once a week for 3–4 weeks. The average tumor volume is plotted with SD; the numbers of mice are as follows. For HSC4 and RKO, huNOG mice (n = 5 or 5 for saline- or nivolumab-treated mice, respectively) and huNOG-FcγR−/− mice (n = 4 or 5 for saline- or nivolumab-treated mice, respectively). For NCI-H1975, huNOG mice (n = 5 or 5 for saline- or nivolumab-treated mice, respectively) and huNOG-FcγR−/− mice (n = 5 or 4 for saline- or nivolumab-treated mice, respectively). For HCC827, huNOG mice (n = 5 or 5 for saline- or nivolumab-treated mice, respectively) and huNOG-FcγR−/− mice (n = 4 or 4 for saline- or nivolumab-treated mice, respectively). More than three independent experiments were repeated for each tumor cell line and representative data were shown. Asterisks indicate statistical significance by a repeated measure ANOVA with Sidak’s multiple comparison test. The p-values are indicated in the inset (*p < 0.05, **p < 0.01, ***p < 0.001, ****p < 0.0001).

