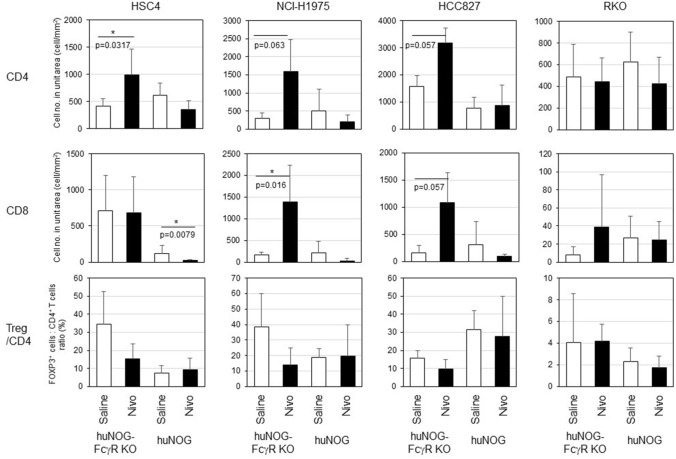
Figure 5.
Quantitation of tumor infiltrating human T cells by image analyses. The IHC images in Fig. 4 were used for enumeration of human T cells infiltrating the tumor. The live tumor area was identified by Halo software. T cells in the live tumor area were identified as horseradish peroxidase (brown) and nuclei (blue) double-positive cells. The graphs in the first and second row show the numbers of human CD4+ and CD8+ T cells per unit live tumor area (T cell number/mm2), respectively. The graphs in the bottom row show the ratio of FOXP3+ T cells to CD4+ T cells in tumors. The means and SD are shown. One representative section was used for the image capture for one mouse and subjected to image analysis. The numbers of mice are as follows. For HSC4, huNOG mice (n = 5 or 5 for saline- or nivolumab-treated mice, respectively) and huNOG-FcγR−/− mice (n = 5 or 5 for saline- or nivolumab-treated mice, respectively). For NCI-H1975, huNOG mice (n = 5 or 5 for saline- or nivolumab-treated mice, respectively) and huNOG-FcγR−/− mice (n = 5 or 4 for saline- or nivolumab-treated mice, respectively). For HCC827, huNOG mice (n = 5 or 5 for saline- or nivolumab-treated mice, respectively) and huNOG-FcγR−/− mice (n = 4 or 3 for saline- or nivolumab-treated mice, respectively). For RKO, huNOG mice (n = 5 or 5 for saline- or nivolumab-treated mice, respectively) and huNOG-FcγR−/− mice (n = 4 or 5 for saline- or nivolumab-treated mice, respectively). Statistical significance was tested by Mann–Whitney U test between saline-treated and nivolumab-treated mice in huNOG or huNOG-FcγR−/− mice (*p < 0.05).

