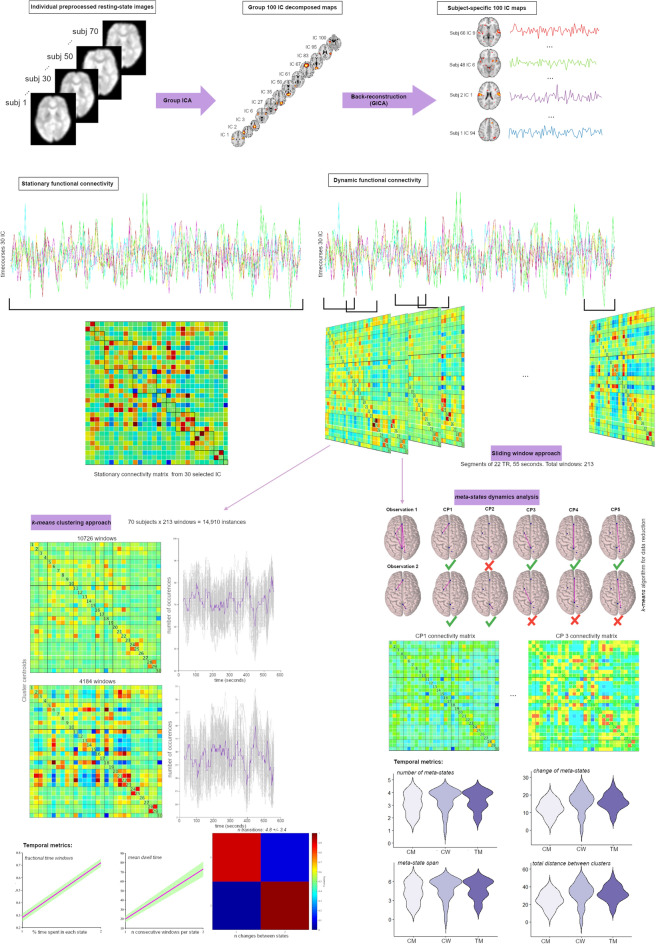
Figure 1.
Summary of analyses steps. Group independent components (IC) analysis decomposes resting-state data of the total 70 subjects into 100 IC components. GICA back-reconstruction is used to estimate subject-specific IC maps and time courses. From the stationary functional connectivity (FC) maps, subject-specific time courses were segmented into 55 s (22 TRs) and moved by 1 TR (2.5 s) = 213 windows. These windows were used to calculate the FC covariance matrices using the sliding window approach. Secondly, these matrices (per subject) were used to classify FC into clustered FC patterns (states) using a k-means clustering approach. From this technique, we obtained temporal metrics such as fractional time windows, the mean of the dwell time per state and number of transitions. Finally, we applied the meta-state dynamic method that models the windowed FC time courses from the sliding window approach as weighted sums of maximally independent connectivity patterns (CP)30. Each CP is recast as a discretized vector of CP weights called meta-state. We used a k-means clustering algorithm for data reduction. We obtained the following metrics: number of meta-states, change of meta-states, meta-state span and total distance between clusters (i.e., CP). The Surf Ice software (https://www.nitrc.org/projects/surfice/) was used to plot the brains, and connectivity matrices were extracted from Matlab R2020b (The MathWorks, Inc., Natick, Massachusetts).

