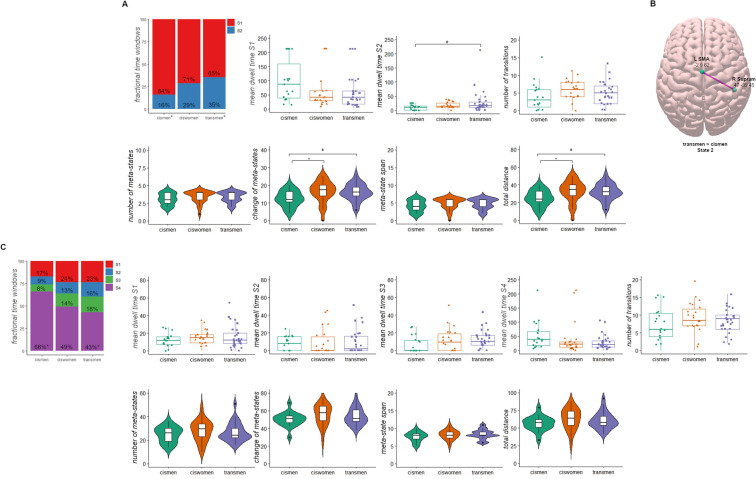
Figure 4.
Temporal properties of the FC states analyses. (A) Bar plot represents the fractional time windows from the 2-states solution, quantitative temporal metrics from the sliding windows k-means clustering approach are represented as box plots, namely dwell time of States 1 and 2 and number of transitions. TM and CM had significant differences in the time they dwelled in State 2. The meta-state dynamic metrics are charted as violin plots. CM differed from CW and TM in the change of meta-states and the total distance between clusters. (B) FC differences in State 2 from the 2-states solution between CM < TM using the threshold-free network-based statistics. L SMA, left supplementary motor area; R Supram, right supramarginal. Surf Ice software was used (https://www.nitrc.org/projects/surfice/). (C) Bar plot represents the fractional time windows from the 4-states solution, quantitative temporal metrics from the sliding windows k-means clustering approach are represented as box plots, namely dwell time of States 1, 2, 3 and 4 and number of transitions. Finally, violin plots represent the 4-states cluster solution of the meta-state dynamics method. Plots were obtained with the ggpubr library (https://cran.r-project.org/web/packages/ggpubr/index.html) using the RStudio v1.4.1106 (PBC, Boston, MA, http://www.rstudio.com/). *Multiple comparison post-hoc test P < 0.05.

