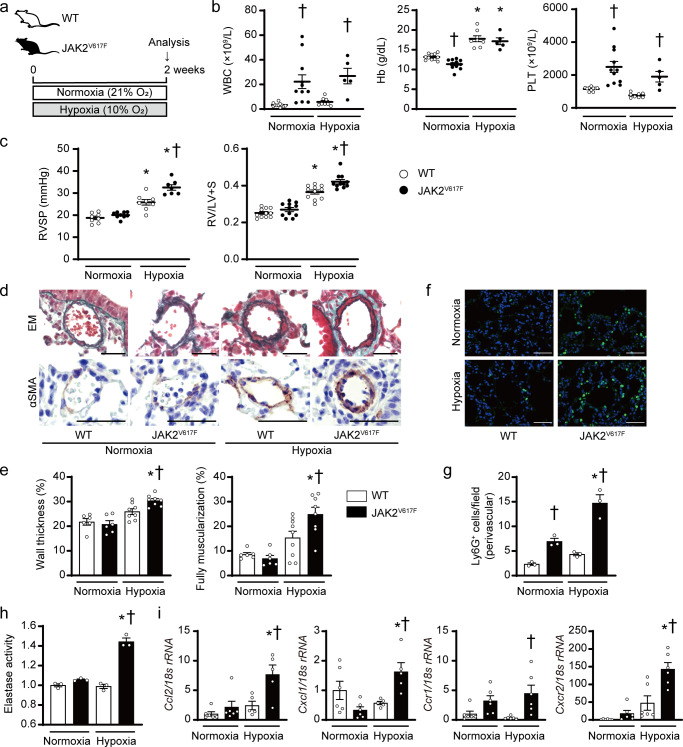
Fig. 1. JAK2V617F mice accelerate pulmonary hypertension accompanied by perivascular neutrophil infiltration in response to chronic hypoxia.
a Experimental design. Wild-type (WT) mice and mice with transgenic expression of Jak2V617F (JAK2V617F) exposed to normoxia (21% O2) or hypoxia (10% O2) for 2 weeks were analyzed. b Peripheral blood cell counts in WT mice or JAK2V617F mice under normoxia or hypoxia for 2 weeks (n = 11, 11, 8, 5, †P = 0.0036 [left], 0.0185 [right] for WBC, n = 11, 11, 8, 5, *P < 0.0001 [left], < 0.0001 [right], †P = 0.0335 for Hb, n = 10, 11, 8, 5, †P = 0.0008 [left], 0.0396 [right] for PLT). c Right ventricular systolic pressure (RVSP, n = 8, 9, 8, 7, *P < 0.0001 [left], <0.0001 [right], †P = 0.0002) and right ventricular hypertrophy determined by the ratio of right ventricle (RV) weight to left ventricle weight plus septum weight (RV/LV + S, n = 11 in each group, *P < 0.0001 [left], <0.0001 [right], †P = 0.0027). d Representative images of Elastica-Masson (EM)-stained sections and sections immunostained with anti-α–smooth muscle actin (αSMA) antibody from WT mice and JAK2V617F mice. Scale bars, 25 µm. e Quantitative analysis of medial wall thickness in EM-stained sections (left, n = 6, 6, 8, 8, *P < 0.0001, †P = 0.0413) and the percentage of muscularized distal pulmonary vessels in αSMA-immunostained sections (right, n = 6, 6, 9, 8, *P = 0.0001, †P = 0.0263). f Representative immunofluorescence images of lung sections stained with anti-Ly6G (green) antibody and DAPI (blue). Scale bars, 50 μm. g Quantitative analysis of Ly6G-positive cells in perivascular regions (n = 3 in each group, *P = 0.0015, †P = 0.0318 [left], 0.0002 [right]). h Elastase activity in the lungs from WT and JAK2V617F mice. The average value from normoxia-exposed WT mice was set to 1 (n = 3 in each group, *P < 0.0001, †P < 0.0001). i Relative mRNA expression levels of Ccl2, Cxcl1, Ccr1, and Cxcr2 in the lungs. The 18 s rRNA was used for normalization. The average value from normoxia-exposed WT mice was set to 1 (n = 6, 6, 5, 5, *P = 0.0049, †P = 0.0105 for Ccl2, n = 6, 6, 5, 5, *P = 0.0044, †P = 0.0284 for Cxcl1, n = 6, 6, 6, 6, †P = 0.0139 for Ccr1, n = 6, 6, 6, 6, *P < 0.0001, †P = 0.0008 for Cxcr2). All data are presented as mean ± SEM. *P < 0.05 versus the corresponding normoxia-exposed group and †P < 0.05 versus the corresponding WT mice by the one-way ANOVA with Tukey post-hoc analysis. WBC white blood cell count, Hb hemoglobin concentration, PLT platelet count. Source data are provided as a Source Data file.

