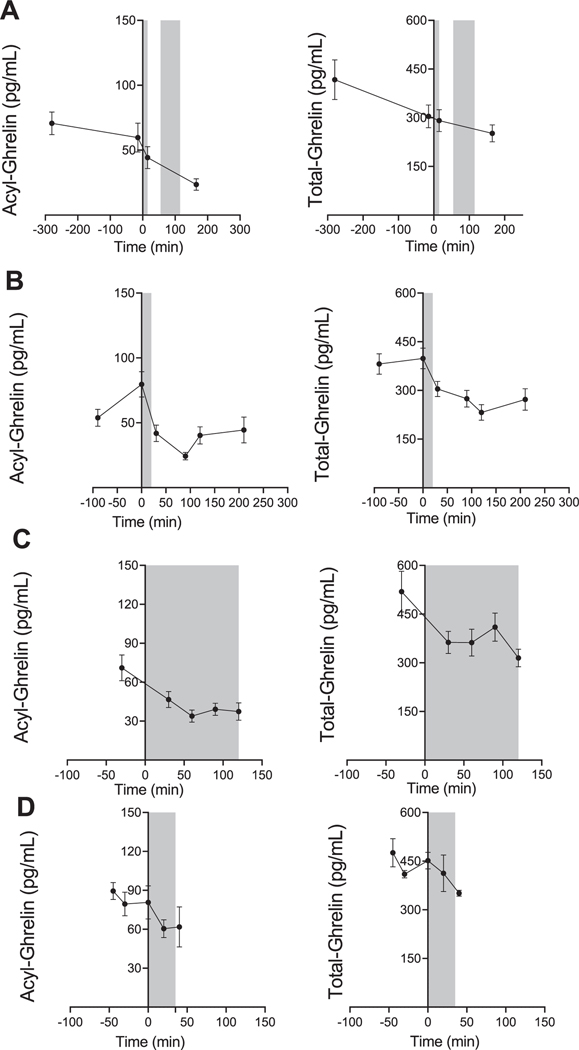
FIGURE 2.
Effect of alcohol administration on peripheral ghrelin levels in humans. Plasma ghrelin levels over the course of different alcohol administration experiments in participants with heavy drinking. Gray zones indicate time periods of alcohol administration. For all data, 0 min = beginning of alcohol administration session. Data are presented as mean ± SEM. (A) Oral alcohol self-administration analysis (N = 16); fixed effect of time (−280, −15, 15, 165) on acyl-ghrelin (left: P < 0.002) and total-ghrelin (right: P = 0.009); pairwise comparisons: Acyl-ghrelin (−280 vs. 165, −15 vs. 165; P < 0.05), total ghrelin (−280 vs. 165; P < 0.05). (B) Oral fixed-dose alcohol administration analysis (N = 12); fixed effect of time (−90, 0, 30, 90, 120, and 210 min) on acyl-ghrelin (left: P < 0.0001) and total-ghrelin (right: P < 0.0001); pairwise comparisons: Acyl-ghrelin (0 vs. −90; P < 0.05, 0 vs. 30, 90, 120, 210; P < 0.001), total-ghrelin (0 vs. −90, 30, 210; P < 0.05, 0 vs. 120, P < 0.001). (C) IV alcohol self-administration analysis (N = 11); fixed effect of time (−30, 30, 60, 90, and 120 min) on acyl-ghrelin (left: P < 0.0001), and total-ghrelin (right: P < 0.0001); pairwise comparisons: Acylghrelin (−30 vs. 30; P < 0.05, −30 vs. 60, 90, 120; P < 0.001), totalghrelin (−30 vs. 30, 60; P < 0.05, −30 vs. 120; P < 0.01). (D) IV fixed-dose alcohol administration analysis (N = 6) evaluated a fixed effect of time point (−45, 0, 20, 30, and 40 min) on acyl-ghrelin (left: P = NS), and total-ghrelin (right: P = NS). P values presented for pairwise comparisons are Bonferroni corrected

