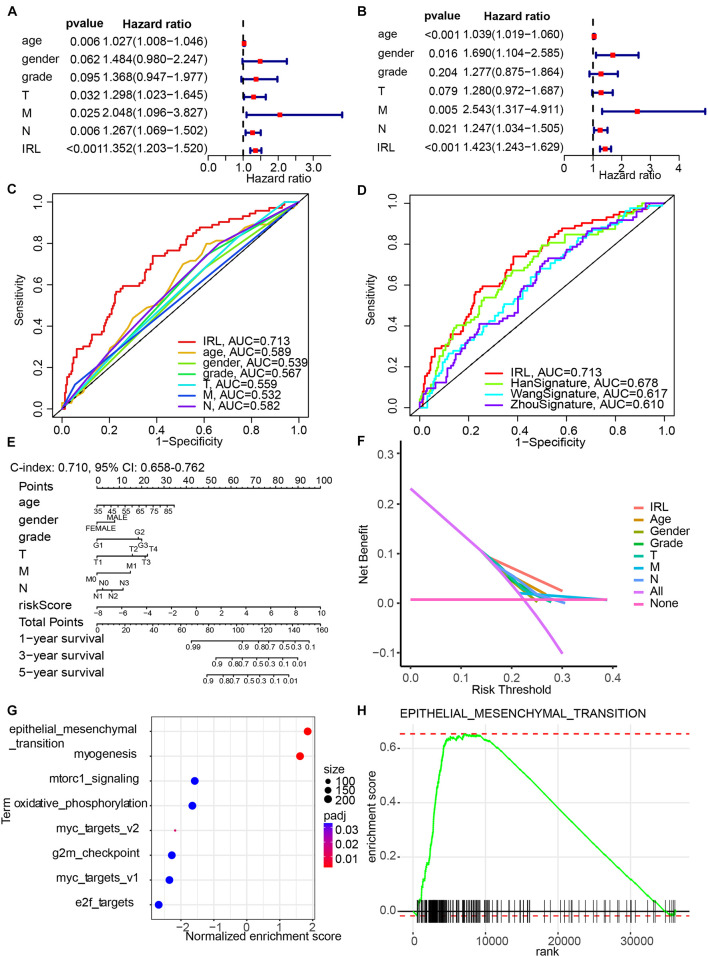
FIGURE 4.
Construction of a nomogram model integrated with the IRL signature. (A,B) Univariate and multivariate Cox analyses included different clinicopathologic features. (C,D) Multivariable ROC curves for overall survival (OS). (E) Nomogram model for predicting the 1-, 3-, and 5-year OS of GC patients. (F) Decision curve analysis of the OS-related nomogram. “None” indicates that all samples were negative without intervention and the net benefit was 0. “All” indicates that all samples were positive with intervention. (G) The bubble plot of gene set enrichment analysis (GSEA) results. (H) The enrichment plot of epithelial–mesenchymal transition.

