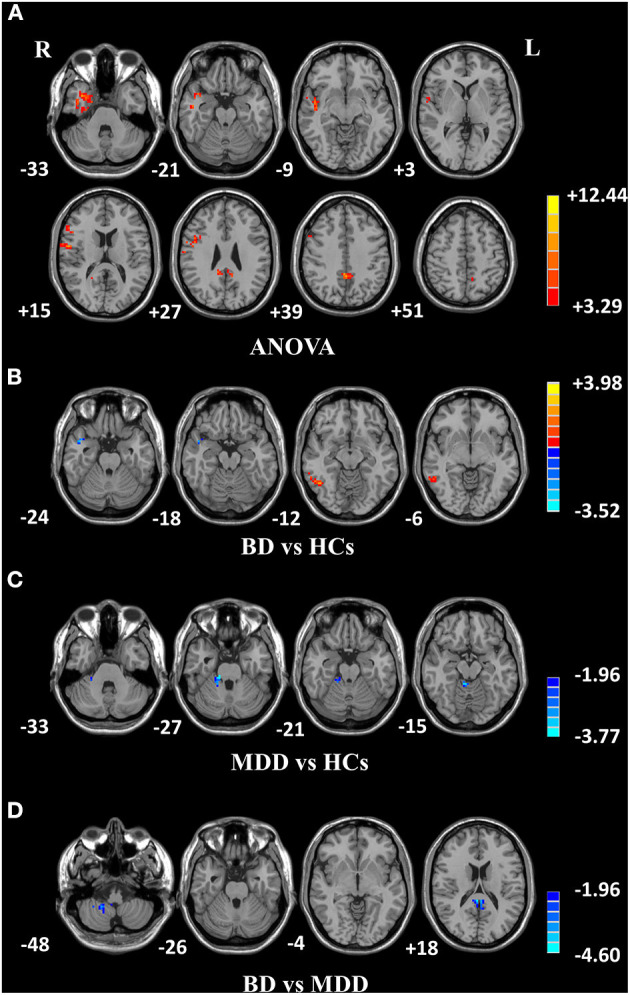
Figure 1.

Differences in fALFF values among groups. (A) Different fALFF values in the right temporal lobe, right frontal lobe, and left precuneus were observed among three groups. (B) Different fALFF values in the right ITG and right MTG were observed between BD and HCs. (C) Different fALFF values in the right cerebellar lobule IV/V were observed between MDD and HCs. (D) Different fALFF values in bilateral PCG and the right cerebellar lobule VIII/IX were observed between BD and MDD. The color bar represents the t values of analyses. Red and blue denote higher and lower fALFF values, respectively. fALFF, fractional amplitude of low-frequency fluctuation; BD, bipolar disorder; MDD, major depression disorder; HCs, healthy controls; L, left hemisphere; R, right hemisphere; ITG, inferior temporal gyrus; MTG, middle temporal gyrus; PCG, posterior cingulate gyrus.
