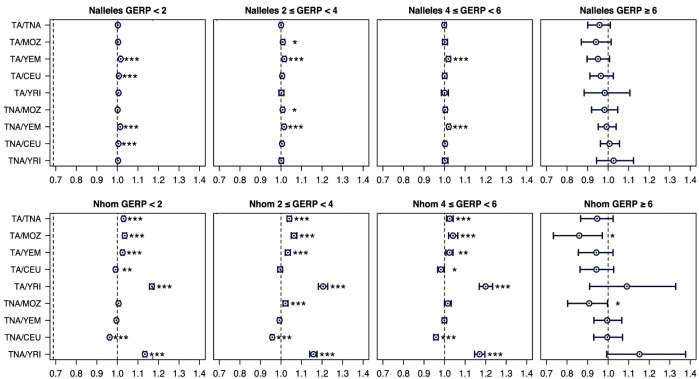
Figure 6.
Comparison of the per-individual number of derived alleles (Nalleles) and homozygous derived genotypes (Nhom) across populations for variants in different GERP RS score categories. Pairwise population ratios of the mean per-individual number of derived alleles and homozygous derived genotypes. Plot title indicates the range of GERP RS scores of the variants included. Error bars represent the 0.025 and 0.975 quantiles obtained by bootstrapping by site 1000 times, dividing the exome data into 1000 blocks and performing bootstrap resampling of blocks 1000 times. Statistical significance is shown in the following way: *p < 0.05, **p < 0.01, ***p < 0.001. To account for multiple testing errors, significance threshold was set to p < 0.001. Population names abbreviated as in Fig. 1.

