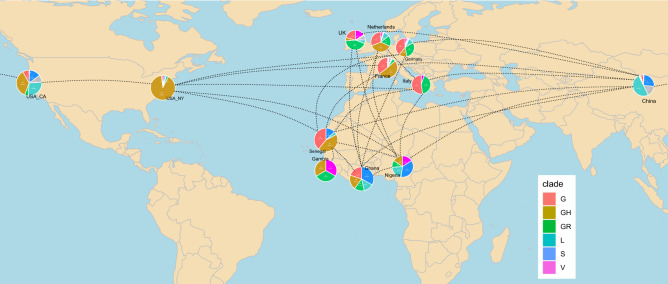
Figure 5.
Geographic map reveals distinct patterns of introduction of China-and Europe-based clades in West African countries (until April 2020). Nigeria with the highest percentage of the China-based early clades (L, S, V) and Ghana with nearly equally distributed percentages of China and Europe-based clades (G, GH, GR) might be comparable with the US West Coast while Senegal with a similar clade distribution like France and few samples from the early China-based clades may be more comparable to the US East Coast. It will be interesting to observe if the later G clades replace the early clades in Nigeria and Ghana and if that correlates with the severity of the disease as was postulated for the US. The R package rworldmap (version 1.3-6, https://cran.r-project.org/web/packages/rworldmap/index.html), South32 was used to generate the world map in this figure using R (version 3.6.1, https://www.r-project.org/), [Ihaka, R. & Gentleman, R. R: A language for data analysis and graphics. J. Comput. Graph. Stat. 5, 299–314 (1996)].

