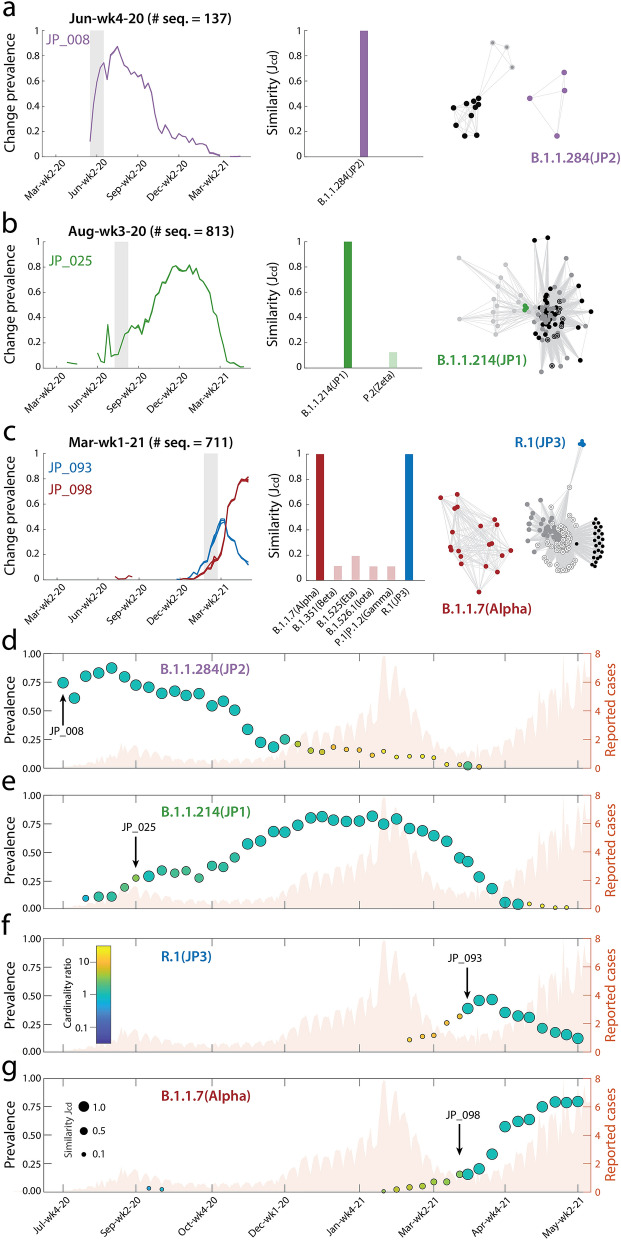
Figure 1.
Data-driven identification of variants in Japan. (a–c), left panels: Four hits in Japan (two of which occurring in the same week), corresponding to clusters JP_008 (Jun-wk4-20), JP_025 (Aug-wk3-20), JP_093, and JP_098 (both observed in Mar-wk1-21). Central panels: Cluster-dictionary similarity () for the four early hits showing, at time of detection, to strongly match ( in all cases) the four lineages B.1.1.284 (JP2), B.1.1.214 (JP1), R.1 (JP3), and B.1.1.7 (Alpha); values are not shown. Right panels: Community detection applied to the within-cluster change co-occurrence matrix evaluated over the period of time between the emergence of two subsequent variants. The resulting interaction network is plotted using a force-directed layout65, with edge lengths inversely proportional to link weights. Colors indicate nodes belonging to communities that strongly match known lineages, other communities are in gray-scale shades. (d–g): Temporal dynamics of the four identified variants. In each scatter plot, the left y-axis value represents the average prevalence of the changes in the cluster-dictionary intersection, circle size represents the cluster-dictionary similarity ( not shown), while circle color is proportional to the log-ratio between the number of changes in the cluster and in the dictionary. Warnings are marked with a labeled arrow. In the background, the number of reported COVID-19 infections (thousand cases, right axis) in Japan66. Plots were created using MATLAB R2021a (http://www.mathworks.com). All graphics were further processed using Adobe Illustrator 2021 (http://www.adobe.com).

