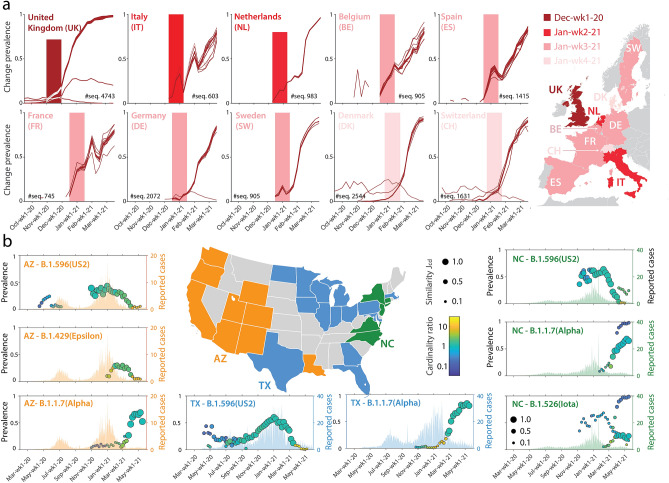
Figure 3.
Temporal dynamics of notable variants in European countries (a) and in the US (b). Color shading for European countries indicates the timing of emergence of the Alpha variant (the lighter, the later). Different colors code instead the couple/triple of variants (Epsilon, Iota, Alpha, and US1/US2 as aliases of B.1.2 and B.1.596—only US2 is shown here) that were detected and tracked in the US using our method. Inset details as in panels (d–g) of Fig. 1. The blank maps of Europe and US were retrieved from https://commons.wikimedia.org/wiki/File:Europe_political_chart_complete_blank.svg and https://commons.wikimedia.org/wiki/File:USA_blank.svg on 4 July 2021 and plots were created using MATLAB R2021a (http://www.mathworks.com). All graphics were further processed using Adobe Illustrator 2021 (https://www.adobe.com).

