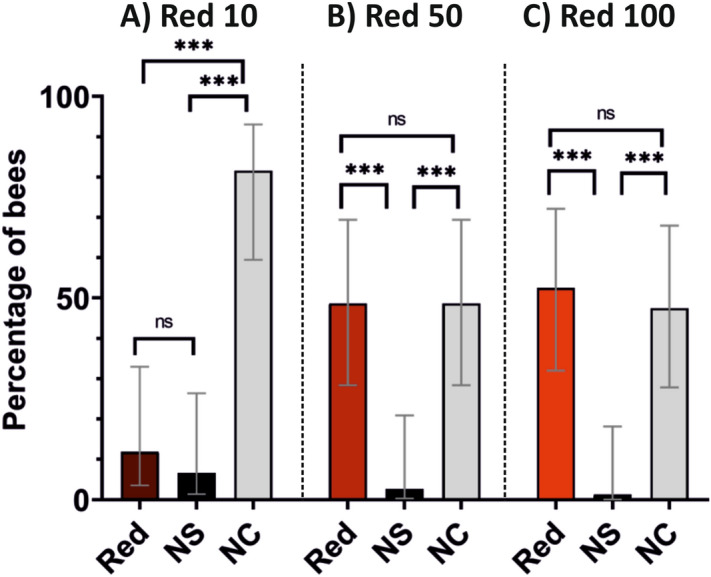
Figure 3.

Experiment 1—Choosing the red intensity for the achromatic black and red background. Quantification of the spontaneous phototactic responses of bees towards a red cuboid (see Fig. 2A). Three different intensities were assayed, each with a different group of bees: Red 10 (RGB: 26, 0, 0; irradiance: 13 μW/cm2; N = 19), Red 50 (RGB: 128, 0, 0; irradiance: 140 μW/cm2; N = 19) and Red 100 (RGB: 255, 0, 0; irradiance: 1130 μW/cm2; N = 20). For each intensity, the figure represents the pooled performance of four consecutive extinction tests in which the spontaneous attraction towards the red cuboid (‘Red’) was quantified. ‘NS’ (no stimulus) represents the choice of an equivalent empty area in the VR arena that was opposite to the red cuboid (see Fig. 2A). NC: no choice. Both the Red-50 and the Red-100 intensities were sufficient to render the red stimulus detectable for honeybees. For subsequent experiments, the Red 100 intensity was chosen.
