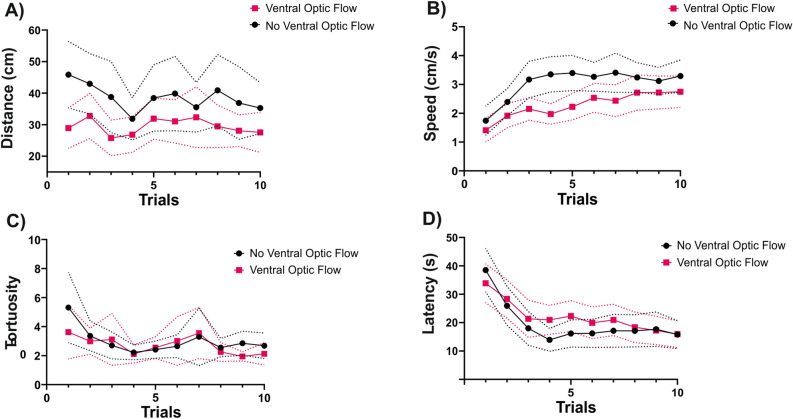
Figure 8.
Motor and temporal components of bee trajectories during the acquisition trials. For each ventral optic-flow condition, the evolution of (A) the distance walked, (B) the walking speed, (C) the tortuosity and (D) the choice latency during training trials is shown. The tortuosity was the ratio between the total distance walked and the straight line connecting the first and the last point of the trajectory during a training trial. ‘Ventral Optic Flow’ (N = 38), ‘No Ventral Optic Flow’ (N = 29). The dashed lines above and below the curves represent the 95% confidence interval.

