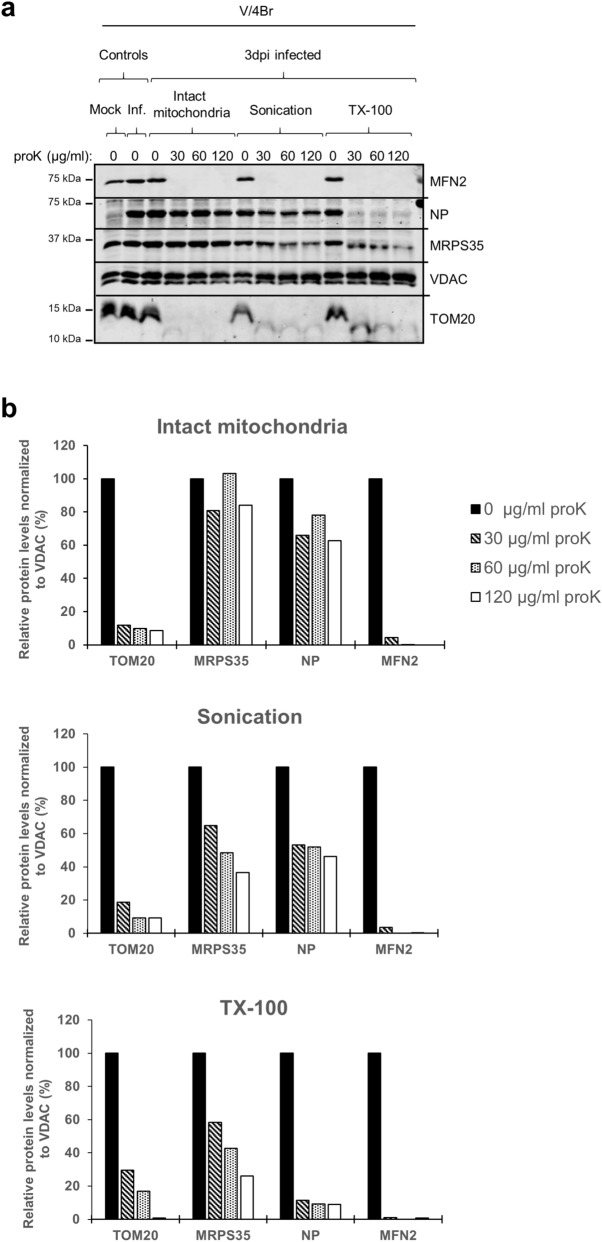
Figure 4.
Submitochondrial analyses of reptarenavirus NP in infected boid cells. (a) Submitochondrial localization assay, protein localization as determined by protease accessibility. Mitochondria were isolated at three dpi from reptarenavirus-inoculated Boa constrictor V/4Br cells and either treated directly with proK at 30, 60 or 120 µg/ml, or subjected to sonication or TX-100 lysis first, and then treated with proK. For each condition, a sample without proK-treatment is provided as a control. An uninfected (Mock) and a reptarenavirus-infected (Inf.) mitochondrial sample at three dpi serve respectively as negative and positive controls for the anti-UHV-NP antibody used to detect the reptarenaviral NP. The samples (25 µg/lane of protein derived from the mitochondrial fraction) were separated through standard SDS-PAGE followed by immunoblotting to detect TOM20 and MFN2 (markers of the OMM), MRPS35 (marker of the mitochondrial matrix), VDAC (loading control) and reptarenaviral NP. Nitrocellulose membrane was cut into upper, middle and lower parts, that were subsequently incubated with antibodies against: upper part, rabbit affinity-purified anti-UHV-NP 1:500 (secondary antibody: IRDye 800CW Donkey anti-rabbit), followed by mouse anti-MFN2 1:200 (secondary antibody: IRDye 680RD Donkey anti-mouse); middle part, rabbit anti-MRPS35 1:1000 (secondary antibody: IRDye 800CW Donkey anti-rabbit), followed by mouse anti-VDAC 1:500 (secondary antibody: IRDye 680RD Donkey anti-mouse); lower part, rabbit anti-TOM20 1:1000 (secondary antibody: IRDye 800CW Donkey anti-rabbit). VDAC, embedded in the OMM membrane, is not affected by proK treatment and thus provides an internal reference for loading. Immunodetections were performed using the Odyssey Infrared Imaging System (LICOR Biosciences), showing also the molecular weight marker (Precision Plus Protein Dual Color Standards, Bio-Rad) used. (b) Quantification of the protein signals from the blot of Fig. 4a was performed by normalizing the signal intensity (determined through Image Studio Lite software, LICOR, Biosciences) of each band of TOM20, MRPS35, reptarenavirus NP and MFN2 to the corresponding one of VDAC, representing the internal loading control. For each condition of intact mitochondria (upper graph), sonication (middle graph) and TX-100 treatment (lower graph), the levels of each protein in proK-treated samples are presented relative to the level of the corresponding proK-untreated sample. Full-length blots are presented in Supplementary Fig. S7.

