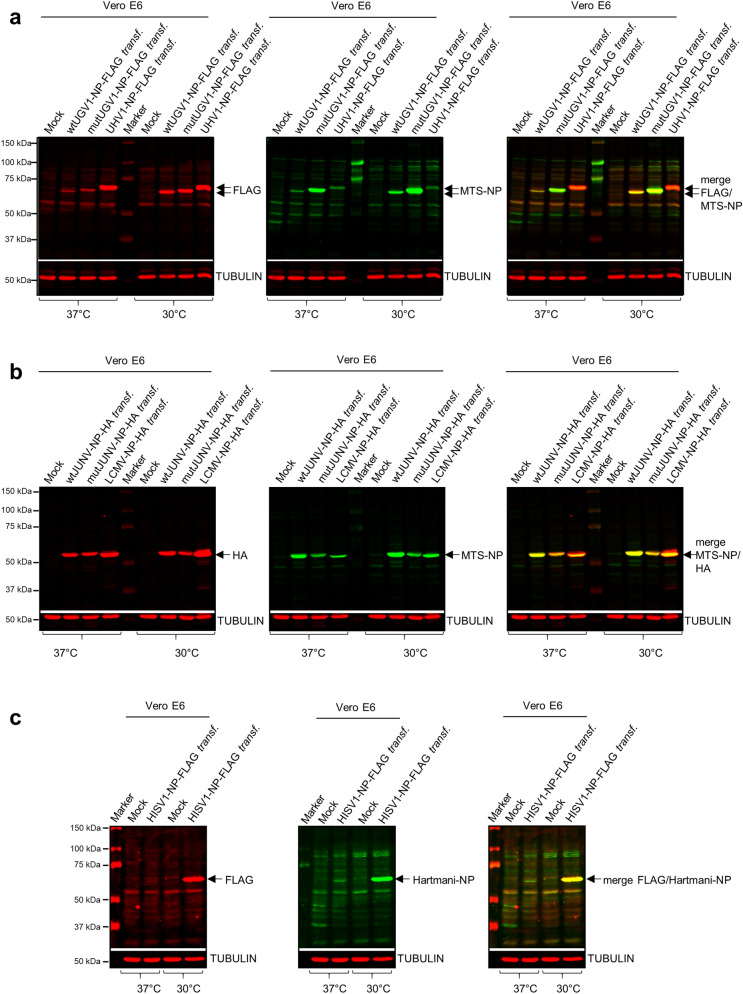
Figure 5.
Immunoblotting studies on arenaviral NPs in transfected mammalian cells. (a–c) Immunoblotting analyses of whole-cell lysates obtained from monkey Vero E6 cells transfected with a construct expressing either wt or mutUGV1-NP-FLAG, or UHV1-NP-FLAG (a), wt or mutJUNV-NP-HA, or LCMV-NP-HA (b), HISV1-NP-FLAG (c), at three dpt after incubation at either 37 °C or 30 °C. Non-transfected (Mock) samples are provided as negative controls. 40 µg of protein per sample were loaded on standard SDS-PAGE gels, followed by immunoblotting. The nitrocellulose membranes were incubated sequentially with the following antibodies in the presented order: (1) mouse anti-FLAG tag 1:500 (a,c) or mouse anti-HA tag 1:500 (b); (2) rabbit anti-MTS-NP 1:200 (a,b) or rabbit anti-Hartmani-NP 1:500 (c); (3) mouse anti-tubulin 1:500 (a–c). Anti-tubulin specific signal at known molecular weight did not require membrane stripping. Tubulin (in red, secondary antibody: IRDye 680RD Donkey anti-mouse) was used as a reference for loading. Reptarenavirus and hartmanivirus (65–68 kDa), and mammarenavirus (63–65 kDa) NPs are indicated (black arrows). (a) Left panel: FLAG tag in red (secondary antibody: IRDye 680RD Donkey anti-mouse); middle panel: MTS-NP in green (secondary antibody: IRDye 800CW Donkey anti-rabbit); right panel: merged image. (b) Left panel: HA tag in red (secondary antibody: IRDye 680RD Donkey anti-mouse); middle panel: MTS-NP in green (secondary antibody: IRDye 800CW Donkey anti-rabbit); right panel: merged image. (c) Left panel: FLAG tag in red (secondary antibody: IRDye 680RD Donkey anti-mouse); middle panel: Hartmani-NP in green (secondary antibody: IRDye 800CW Donkey anti-rabbit); right panel: merged image. Immunodetection was performed using the Odyssey Infrared Imaging System (LICOR, Biosciences) providing also the molecular marker (Precision Plus Protein Dual Color Standards, Bio-Rad) used. Full-length blots are presented in Supplementary Fig. S8.

