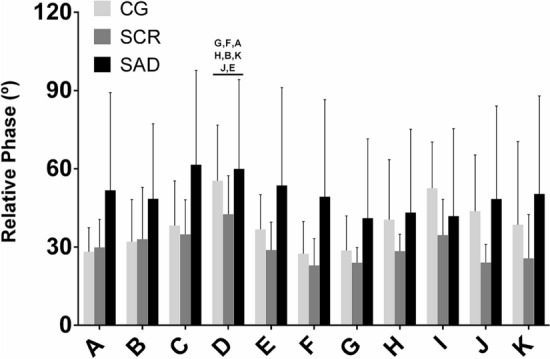
Figure 6.

Footfall-RAC Relative Phase means and standard deviation in the three groups in the three experimental conditions defined by phase (A–K). The letters indicate the significant differences between phases. Note the higher relative phase and the higher variability in SAD group for Footfall-RAC Relative Phase in almost all experimental conditions. It is also possible to identify a trend for a synchronization error/RAC Period dependency.
