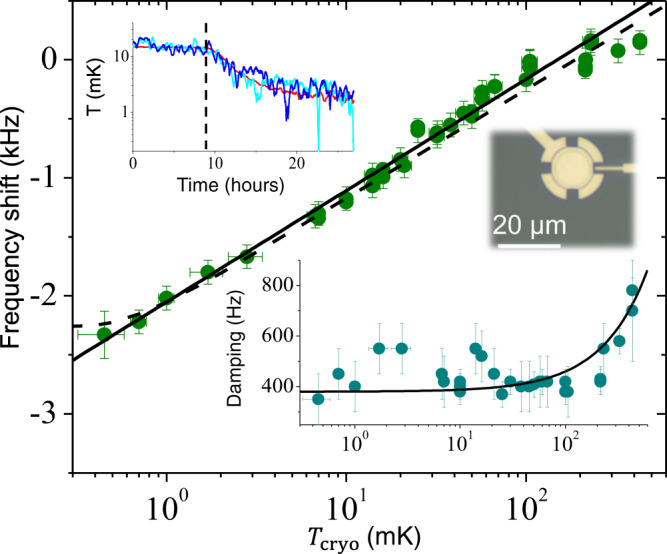
Fig. 1. Mechanical properties versus temperature.

Main graph: mechanical mode frequency shift (ωm[T] − ω0)/(2π) (with respect to ω0/(2π) ≈ 15.1 MHz) as a function of cryostat temperature. The black line is a simple Logarithmic fit, whereas the dashed line is the full theoretical fit function (see text). An optical picture of a device from the same batch is also shown. Bottom inset: corresponding mechanical damping Γm/(2π). The black line is a linear fit (see text). Top inset: measured temperatures at beginning of cooling in a demagnetisation process (starting at the dashed vertical). The red curve corresponds to the cryostat Tcryo, whereas the two blue curves are mechanical mode temperatures Tmode calculated from the spectrum (from two distinct runs, see text). Error bars correspond to type A uncertainties extracted from the fitting process (Supplementary Note 3).
