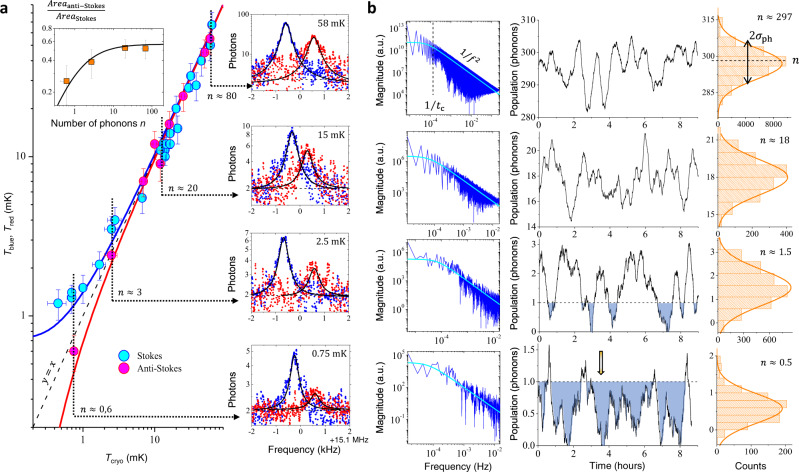
Fig. 2. Passive ground state cooling.
a Main graph: the peak area of blue and red sideband pumping measurements leads to two different Tblue, Tred estimates, ∝ n + 1 and ∝ n (blue and red lines) respectively, a phenomenon known as sideband asymmetry20. Right insets: sideband peaks (blue and red colour for Stokes and anti-Stokes) measured for four different temperatures, with their Lorentzian fits (vertically shifted to two-photon baseline for readability). The slight shift in position (with respect to the actual ωm[T]) is due to a small remnant optical spring due to imperfect tuning of the pump frequency, whereas the difference in peak heights at high temperature is owing to the small amplifying/de-amplifying occurring at the finite input power we use (see text and Supplementary Note 2). The smallest Anti-Stokes peak required 4 days of continuous averaging. Left top inset: ratio of anti-Stokes and Stokes peak areas enabling sideband asymmetry thermometry (the black line is the theoretical expectation). b Measurement of in-equilibrium population fluctuations at 220, 13, 1.4, and 0.65 mK (top to bottom) obtained with 20 minutes averaging time per point. Middle: time traces (9 h span) demonstrating very slow (and large, see also inset Fig. 1) fluctuations. The shaded areas delimit the regions below 1 phonon. Left: spectrum (FFT transform of autocorrelation) showing a 1/f2 type dependence (full line fit) with a low-frequency cutoff 1/tc (dashed vertical). Right: corresponding histograms from which average n and standard deviation σph can be defined (with Gaussian fit displayed; the slight negativity for the two lowest graphs is due to the finite precision of the analysis procedure, see text and Supplementary Note 3). Error bars (type A uncertainty) mostly arise from the finite stability of mechanical parameters (frequency, damping, see Fig. 1) and are explained in Supplementary Note 3. Note the arrow on the central lowest time trace that points to a time slot where the measured population drops below our resolution for ~5 mins (see text).

