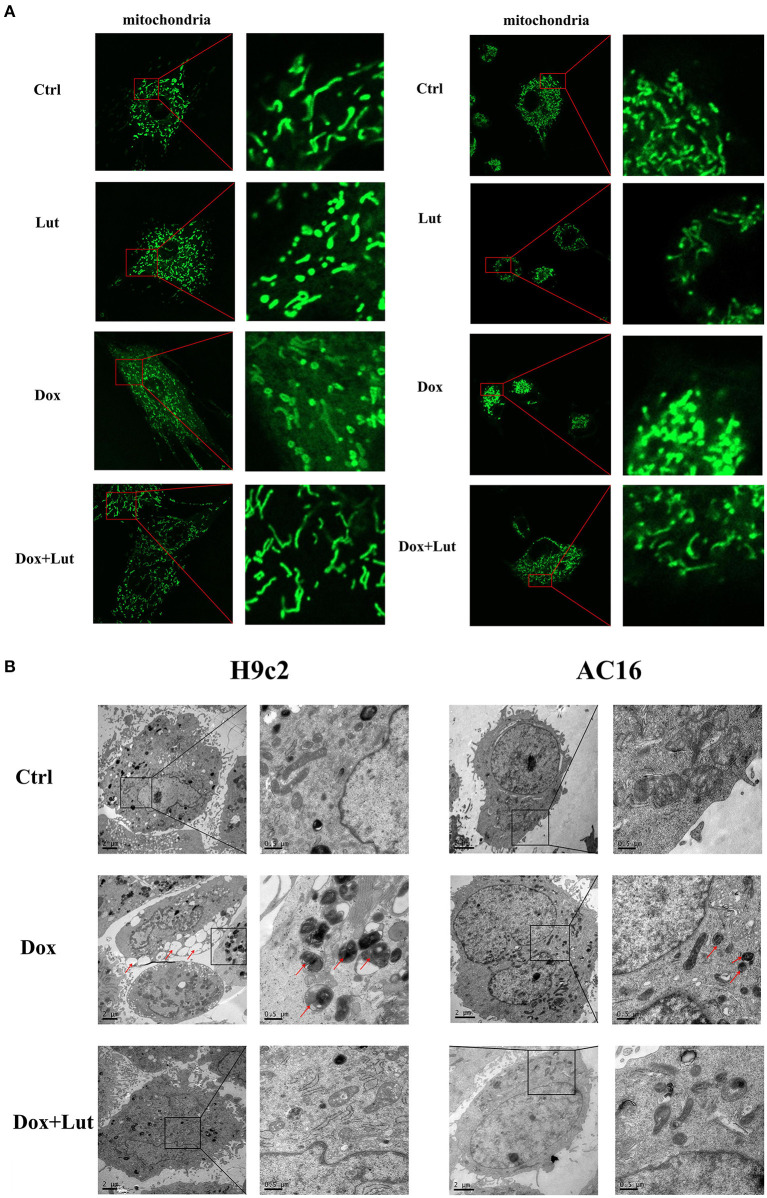
Figure 4.
Effect of Lut treatment on Dox-induced changes in cardiomyocyte mitochondrial morphology. (A) Representative fluorescence images of the morphology of mitochondria in H9c2 (left) and AC16 (right) cells (630×). (B) Transmission electron microscopy images of the morphology of mitochondria in H9c2 (left) and AC16 (right) cells (12,000×). Red arrows show autophagosome.

