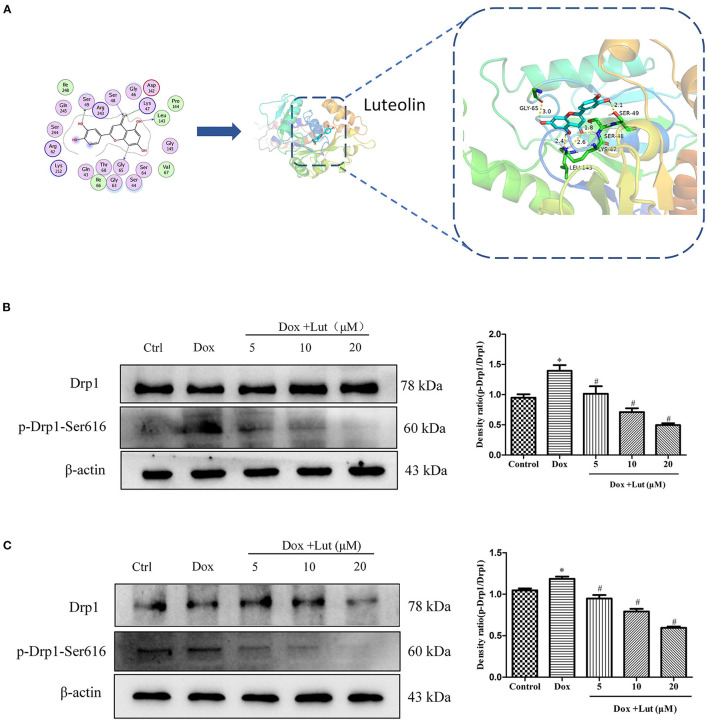
Figure 5.
Lut attenuated Dox-induced Drp-1 phosphorylation in H9c2 and AC16 cells. (A) Detailed molecular docking simulations. The blue circle on the left represents the binding site of the small-molecule compound, and the bar graph on the right describes the specific form of this interaction. Representative Western blot images of Drp-1 and p-Drp-1 in H9c2 (B) and AC16 (C) cells. Mean ± SD, n = 3 independent experiment. *P < 0.05 compared with control group. #P < 0.05 compared with Dox group.

