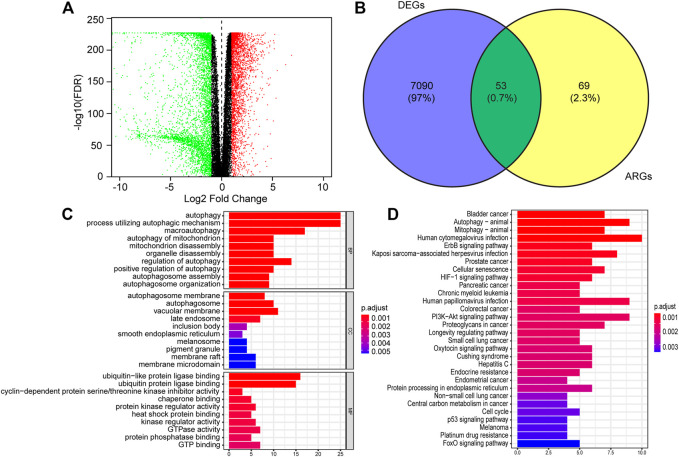
FIGURE 1.
Identification of differentially expressed autophagy-related genes (DE-ATGs) in low grade glioma (LGG) and enrichment analysis. (A) Volcano plot of DEGs in 529 tumor tissues of The Cancer Genome Atlas (TCGA) dataset and 1,035 normal samples from The Genotype-Tissue Expression (GTEx). The vertical axis indicates the–log [adjusted p value (adj. p value)], and the horizontal axis indicates the log2 [fold change (FC)]. The red dots represent upregulated genes, and the green dots represent downregulated genes (adj. p value <0.01 and |log2(FC)| > 1). (B) Venn diagram showing the 53 DE-ARGs (the intersection of the DEGs and ARGs). (C) Biological processes (BP), Cellular components (CC) and Molecular functions (MF) enriched in the DE-ARGs. (D) Kyoto Encyclopedia of Genes and Genomes (KEGG) pathways enriched in the DE-ARGs.

