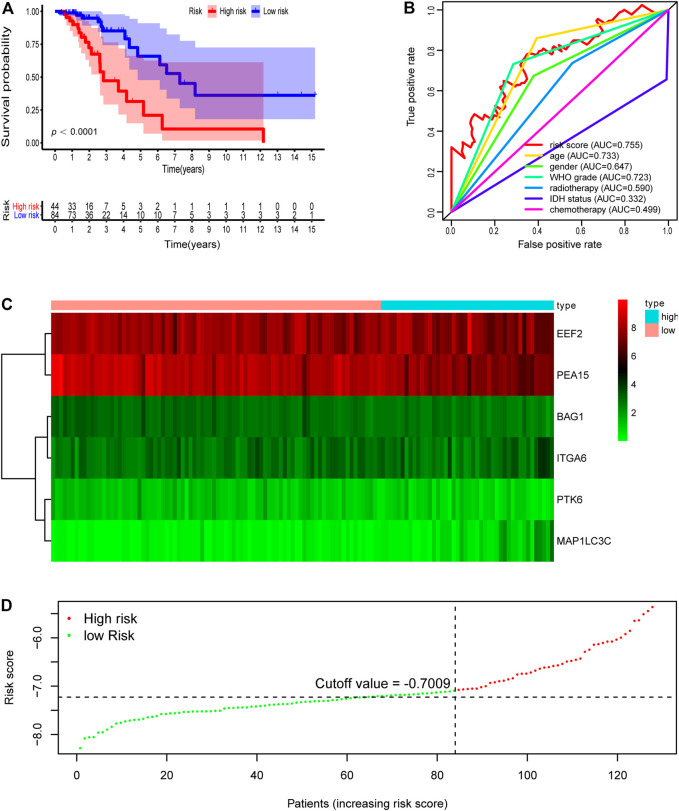
FIGURE 3.
Development of risk score based on the six autophagy-related gene signature of patients with TCGA-LGG validation set. (A) Kaplan-Meier plot for overall survival (OS) based on risk score of the six gene based signature of patients with TCGA-LGG validation cohort. (B) ROC curve for 5 years OS in validation cohort. (C) Heatmap of the six autophagy-related gene expression in the validation cohort. (D) Risk plot of each point sorted based on risk score. The black dotted line is the optimal cutoff (−7.009) classifying patients into low risk and high risk groups.

