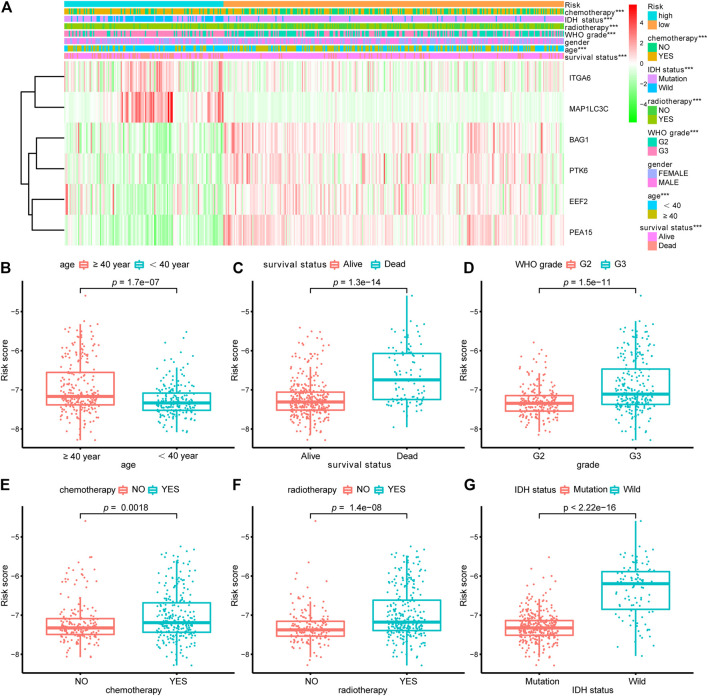
FIGURE 5.
Relationship between the signature risk scores and clinical factors. (A) The heatmap showed the relationship between the risk signature and the clinical features (chemotherapy, IDH status, radiotherapy, grade, gender, age and survival status) in the LGG-whole cohort. (B–G) The box plots revealed the association between risk score and clinical parameters. *p < 0.01, **p < 0.001, ***p < 0.0001.

