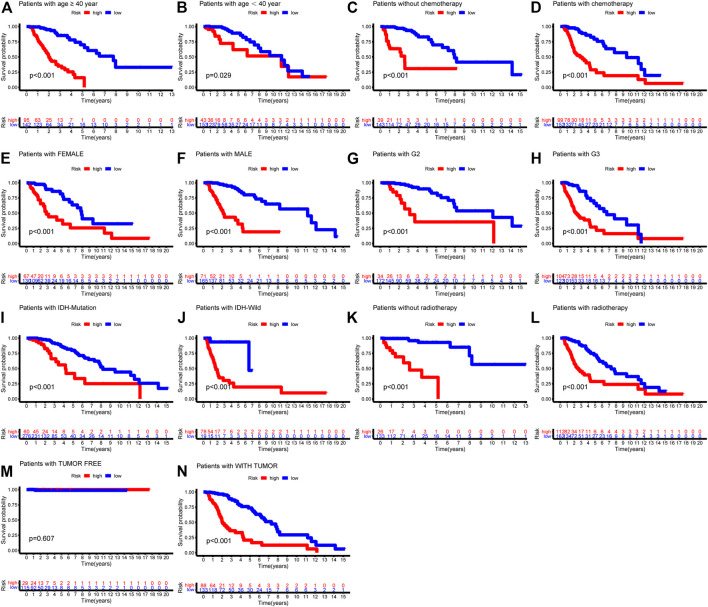
FIGURE 6.
Kaplan-Meier survival curves showed prognostic values of the risk signature in different subgroups of LGG-whole cohort. (A) age ≥ 40; (B) age < 40; (C) without chemotherapy; (D) chemotherapy; (E) Female; (F) Male; (G) G2; (H) G3; (I) IDH-mutation type; (J) IDH-wild type; (K) without radiotherapy; (L) radiotherapy.

