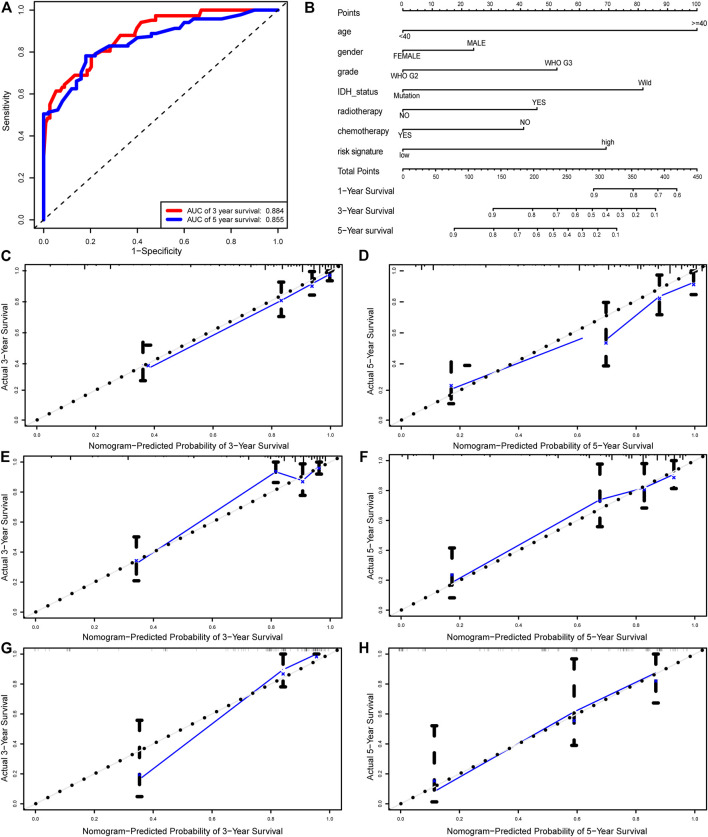
FIGURE 7.
Nomogram built to predict the prognosis of patients with LGG. (A) ROC analysis for 3 and 5 years OS predictions with the nomogram. (B) A nomogram based on risk score and other clinical parameters for predicting 3 and 5 years OS of LGG. Calibration curves of nomogram for predicting probabilities of 3 years (C), and 5 years (D) overall survival of patients in the whole cohort. The calibration plots of for predicting probabilities of 3 years (E), and 5 years (F) overall survival of patients in the training cohort. The calibration plots of for predicting probabilities of 3 years (G), and 5 years (H) overall survival of patients in the validation cohort. The blue line indicates actual survival.

