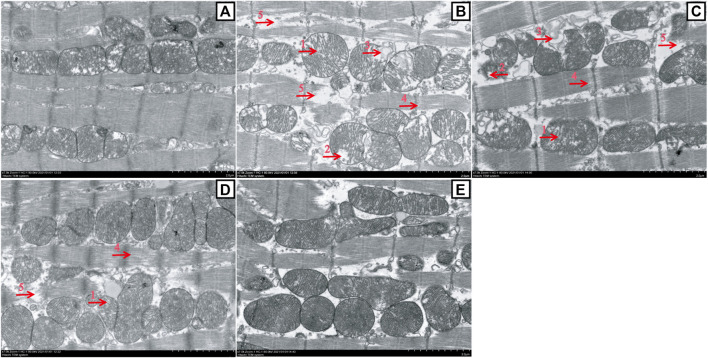
FIGURE 7.
Changes in myocardial mitochondrion ultrastructure between the ATO group and HES treatment groups (scale bar = 2.0 μm, magnification: 7000 ×). A to E represent the CONT, ATO, HESL, HESH, and HES groups, respectively. TEM images show the ultrastructure changes of myocardial mitochondria: the mitochondria were swollen, and the cristal space was enlarged (arrow 1); the crest became short or dissolved and disappeared (arrow 2); the cristae disappeared, and the mitochondria were vesicular (arrow 3); the space between myofilaments was enlarged (arrow 4); and myofilaments broke, dissolved and disappeared (arrow 5).

