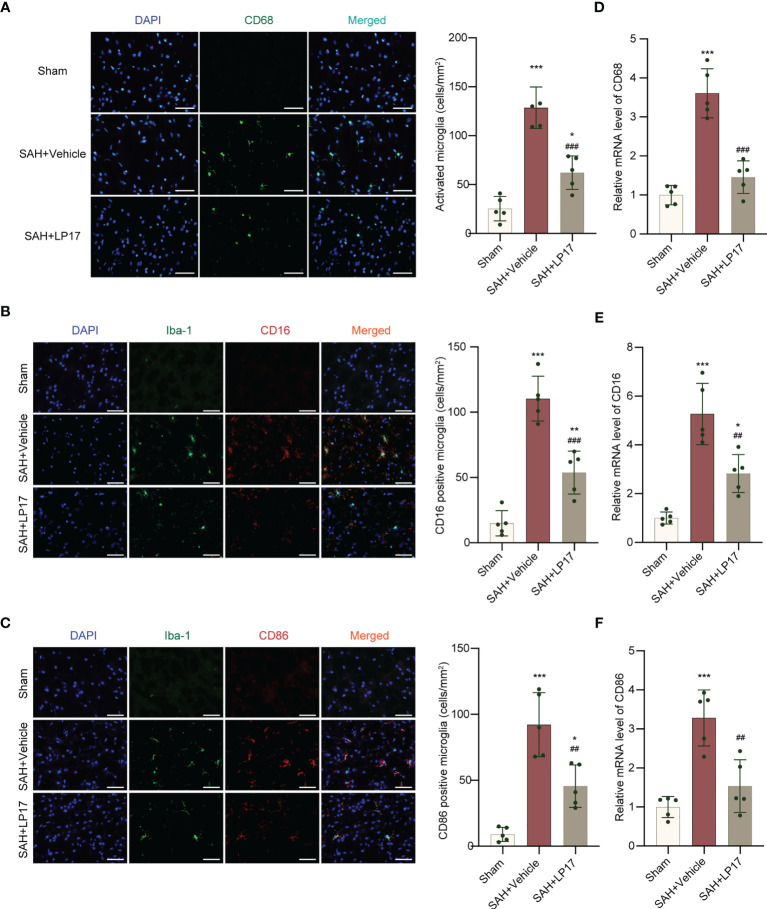
Figure 4.
LP17 treatment inhibited activation and proinflammatory subtype transition of microglia. (A) Representative photograph and quantitative analysis showed the CD68 positive cell (green) in different groups. n = 5/group. (B) Representative photograph and quantitative analysis showed the co-localization of CD16 positive cell (red) with Iba-1 (green) in different groups. n = 5/group. (C) Representative photograph and quantitative analysis showed the co-localization of CD86 positive cell (red) with Iba-1 (green) in different groups. n = 5/group. (D–F). Relative mRNA levels of proinflammatory subtype microglia marker genes (CD68, CD16, CD86). n = 5/group. Data are expressed as mean ± SD. *P < 0.05, **P < 0.01, ***P < 0.001 vs Sham group; ##P < 0.01, ###P < 0.001 vs SAH+vehicle group. Scale bar = 50 μm.

