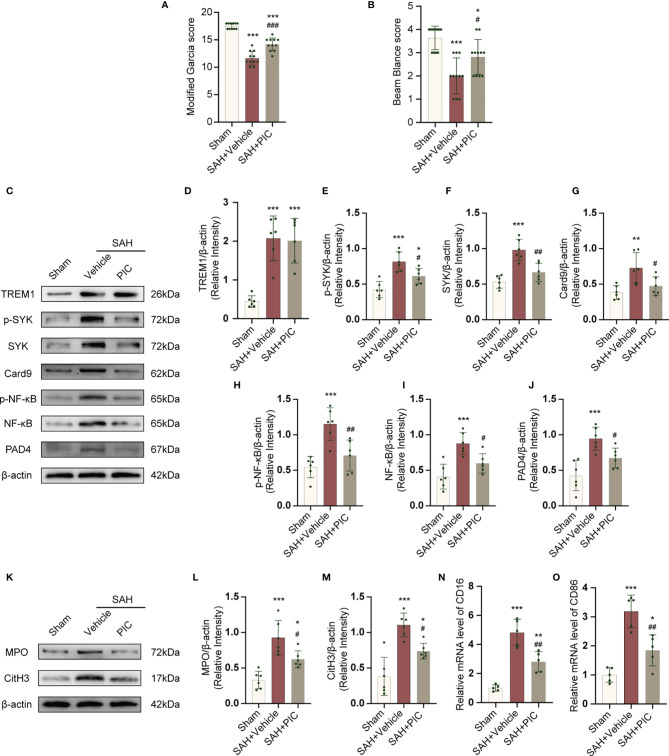
Figure 8.
TREM1-induced SYK activation triggered proinflammatory subtype microglia and the formation of NETs after SAH. (A, B) Quantification of neurological function (modified Garcia score and beam balance test) at 24 h after SAH. n = 11/group. (C–J) Representative western blotting images and quantitative analysis of TREM1, p-SYK, SYK, Card9, p-NF-κB, NF-κB, and PAD4 in cortex in different groups. Control images of β-actin are re-used for illustrative purposes. n = 6/group. (K–M) Representative western blotting images and quantitative analysis of MPO and CitH3 in cortex in different groups. Control images of β-actin are re-used for illustrative purposes. n = 6/group. (N, O) Relative mRNA levels of proinflammatory subtype microglia marker genes (CD16, CD86). n = 5/group. Data are expressed as mean ± SD. *P < 0.05, **P < 0.01, ***P < 0.001 vs Sham group; #P < 0.05, ##P < 0.01, ###P < 0.001 vs SAH+vehicle group.

