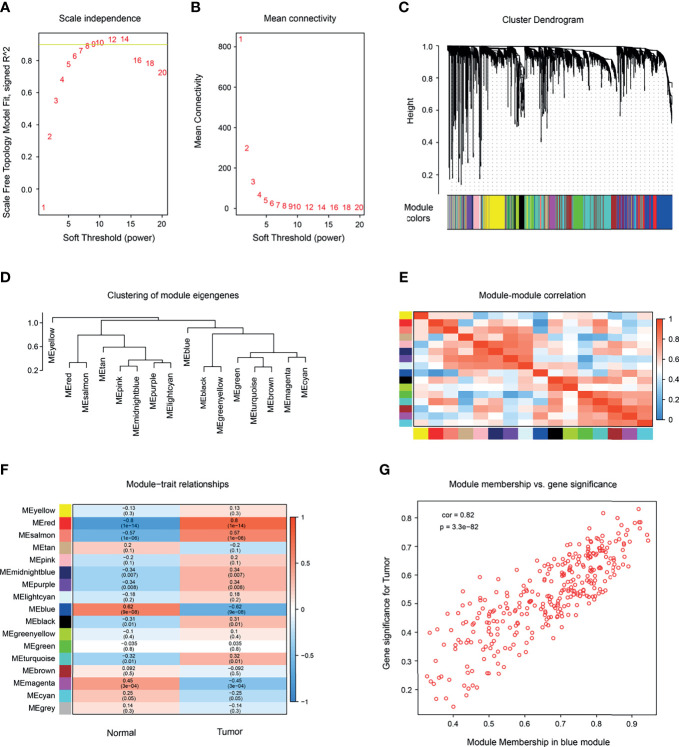
Figure 1.
Construction of a co-expression network by WGCNA. (A) Determination of soft-thresholding power in WGCNA analysis. Scale-free fit index of WGCNA for various soft-thresholding powers (β). (B) Analysis of the mean connectivity under the different soft-thresholding powers. (C) Dendrogram of the differentially expressed genes (DEGs), clustered based on dissimilarity measure clustering (1-Tom). (D) Clustering of module genes. (E) Heatmap of the correlation among modules (red represents high correlation; blue represents low correlation). (F) Correlation between gene modules and clinical characteristics of melanoma (red indicates high positive correlation; blue indicates high negative correlation). (G) The relationship between gene significance and module membership of the blue module was analyzed.

