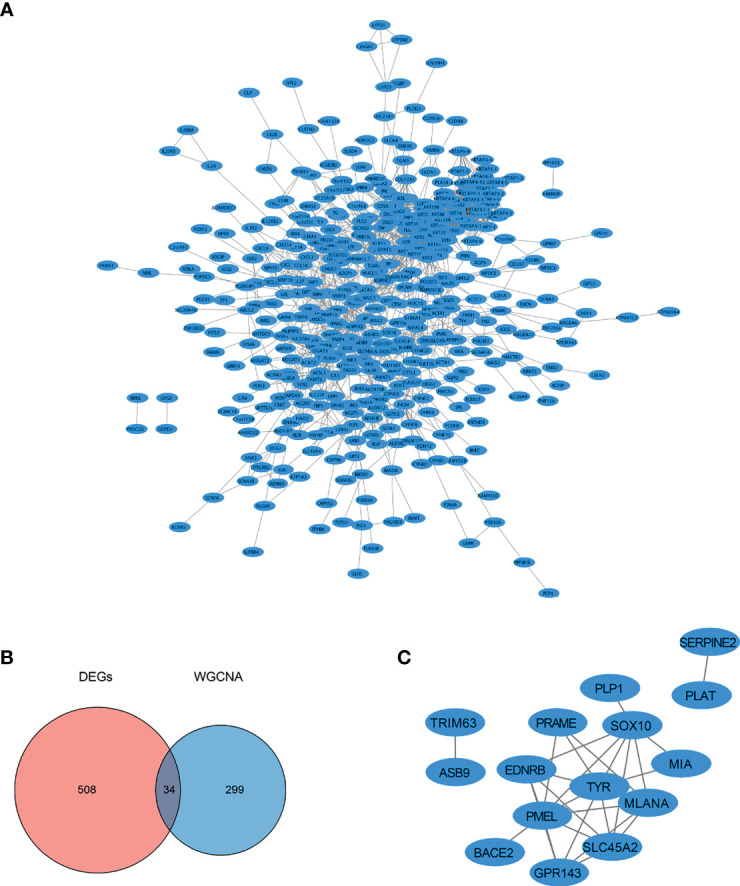
Figure 4.

PPI network diagram of the DEGs. (A) PPI network of the genes obtained from DEGs analysis. (B) Intersection of DEGs identified by the DEGs analysis and SKCM-related genes identified by WGCNA. (C) PPI network of intersecting DEGs and SKCM-related genes identified by WGCNA.
