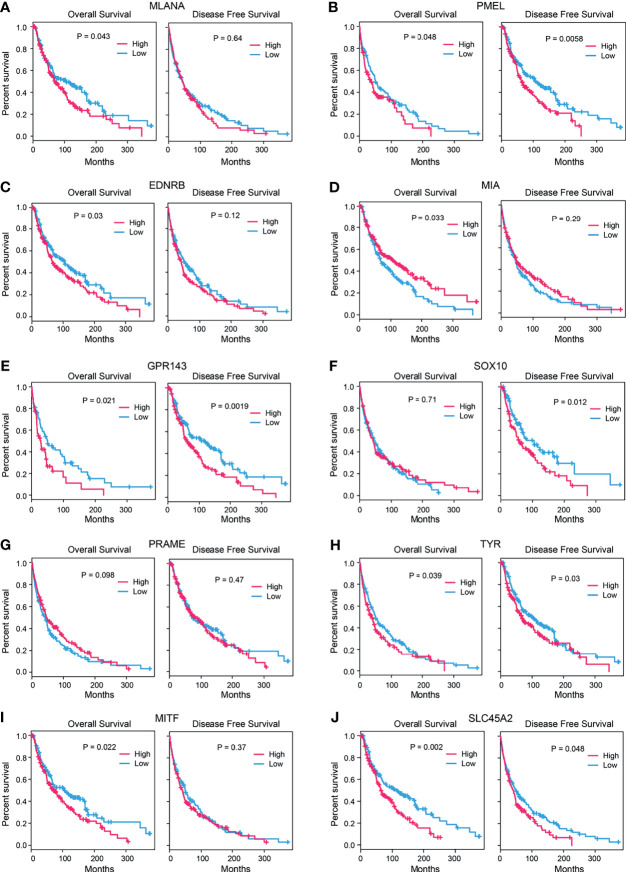
Figure 5.
Survival analysis of candidate genes. Correlation between the expression levels of candidate genes (A) MLANA, (B). PMEL, (C) EDNRB, (D) MIA, (E) GPR143, (F) SOX10, (G) PRAME, (H) TYR, (I) MITF, and (J) SLC45A2 and the survival rates (left: overall survival, right: disease-free survival) of the SKCM patients (p-value: log-rank test).

