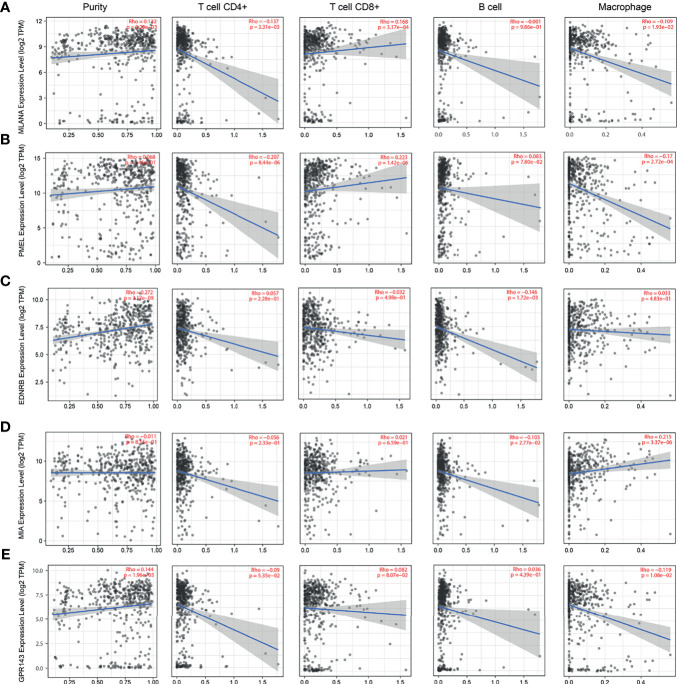
Figure 6.
Correlation between candidate genes and immune cell infiltration of MLANA, PMEL, EDNRB, MIA, and GPR143. (A) Correlation between the expression of candidate genes (A) MLANA, (B). PMEL, (C) EDNRB, (D) MIA, and (E) GPR143 and the levels of immune cell infiltration (tumor purity, CD4+ T cells, CD8+ T cells, B cells, and macrophages from left to right, respectively).

